
Epigene 450k Analysis Report
- Introduction
- Analysis and Results
- Quality control plots
- Normalization
- Excluded probes
- Blood cell counts
- Batch effect correction
- Differentially methylated positions found by minfi::dmpFinder()
- Differentially methylated positions found by limma regression
- Differentially methylated positions found by Mann-Whitney U-test
- Differentially methylated positions identified by the interesection of all specified selection methods
- Venn diagrams
- Principal component analysis plots
- Sample classification scores
- Analysis parameters
- References
Introduction
This report was generated on 2020-03-26.
This pipeline (Epigene) is built atop the GenPipes system from McGill University and Génome Québec Innovation Centre (MUGQIC) and uses the open-source R package minfi for the Illumina 450k platform.
Epigene takes raw .IDAT files and performs a series of optional preprocessing steps on them. Several normalization methods can be performed before the data is analyzed for differentially methylated positions and regions. The final output of a full pipeline run is a list of CpG sites and their methylation levels, a list of differentially methylated positions, and a list of differentially methylated regions.
Analysis and Results
A total of 44 samples have been analyzed. Among these 44 samples, the following groups were specified in the sample sheet:
 29 KS
  9 normal
  6 unknown
Any number of the group types as specified by the provided contrasts can be selectively compared. The contrasts chosen for the current analysis are described below:
| Contrast name | Number of controls | Number of cases |
|---|---|---|
| KS | 9 | 9 |
Quality control plots
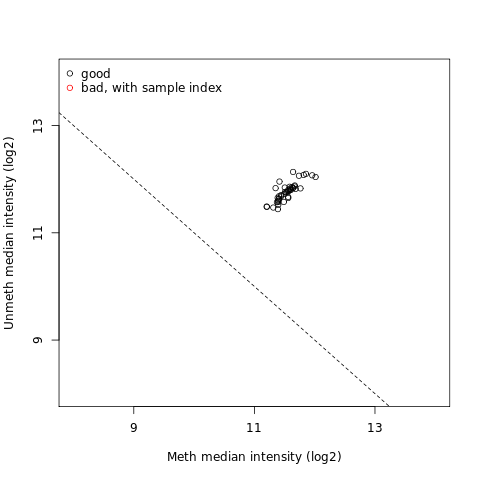
QC plot
Density plot
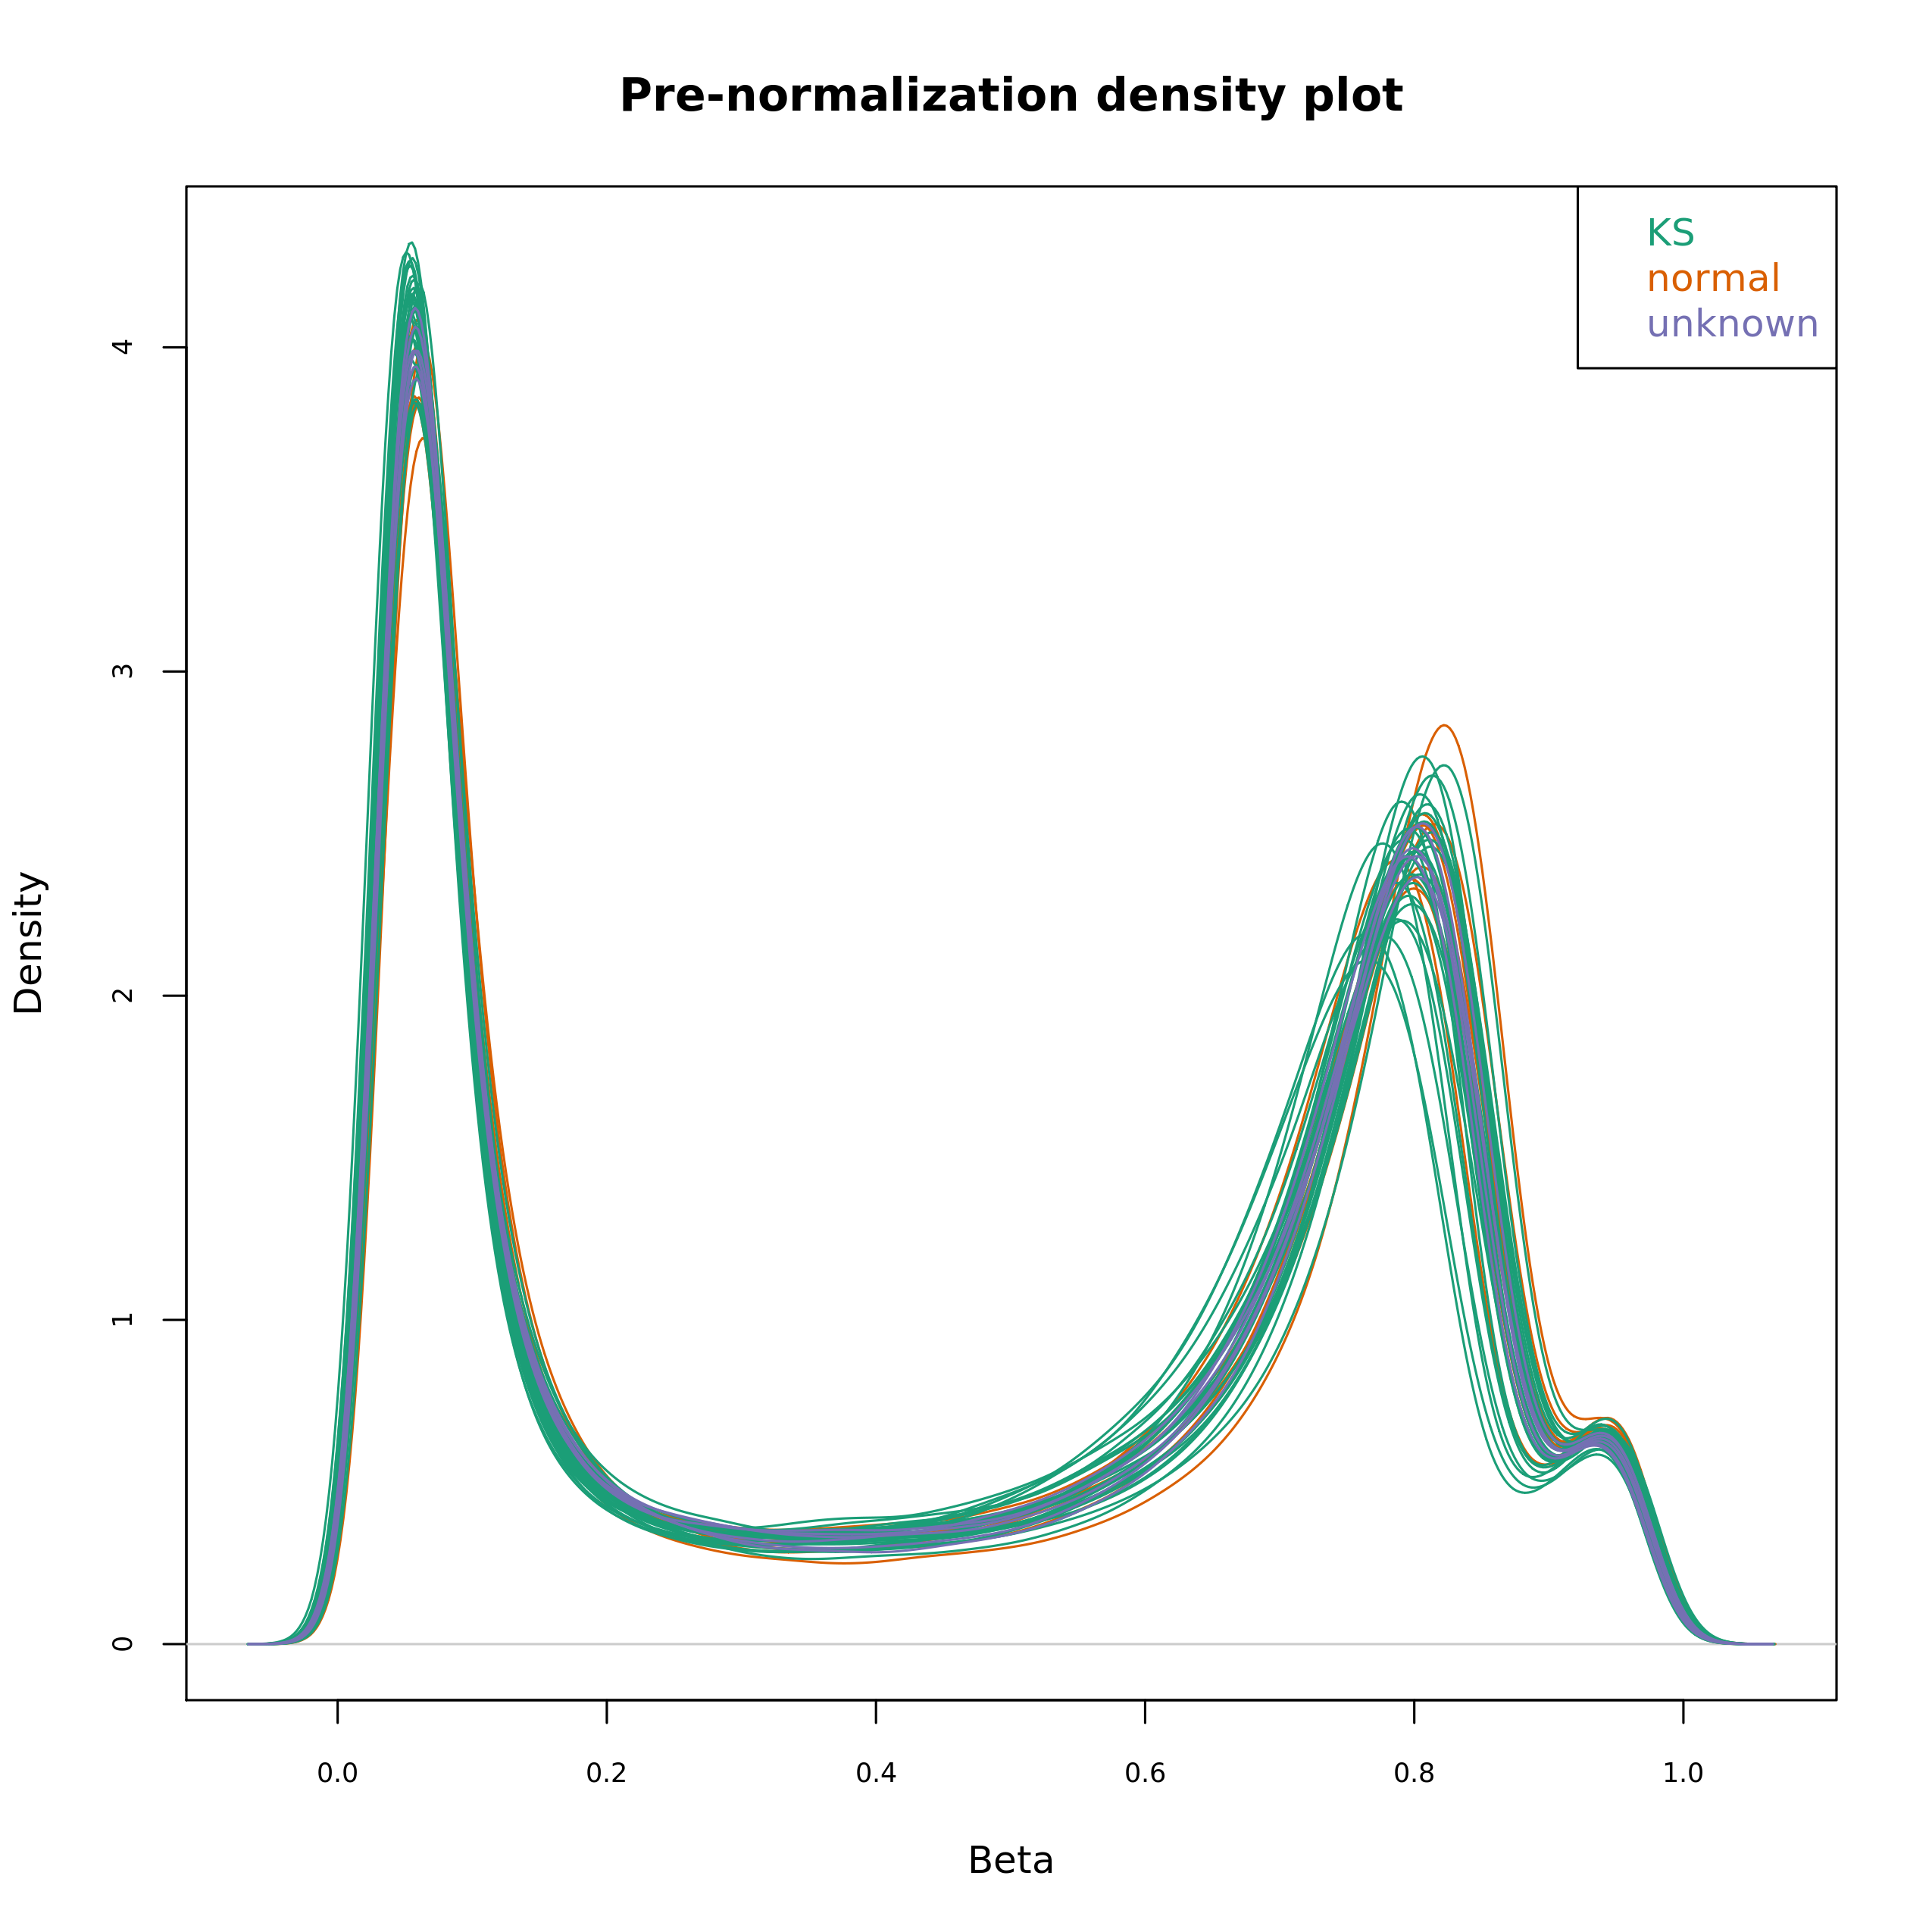
Density Plot
Report
Normalization
Normalization refers to adjusting values measured on different scales to a more common standardized scale. A proper normalization is important in the analysis, firstly to avoid any enrichment toward any probe type in the differential methylated analysis and secondly to reduce non-biological (technical) variability between samples.
Normalization method used is illumina.
The effect of normalization can be seen by generating a density bean plot using the normalized data and comparing it with the pre-normalization density plot (pictured):
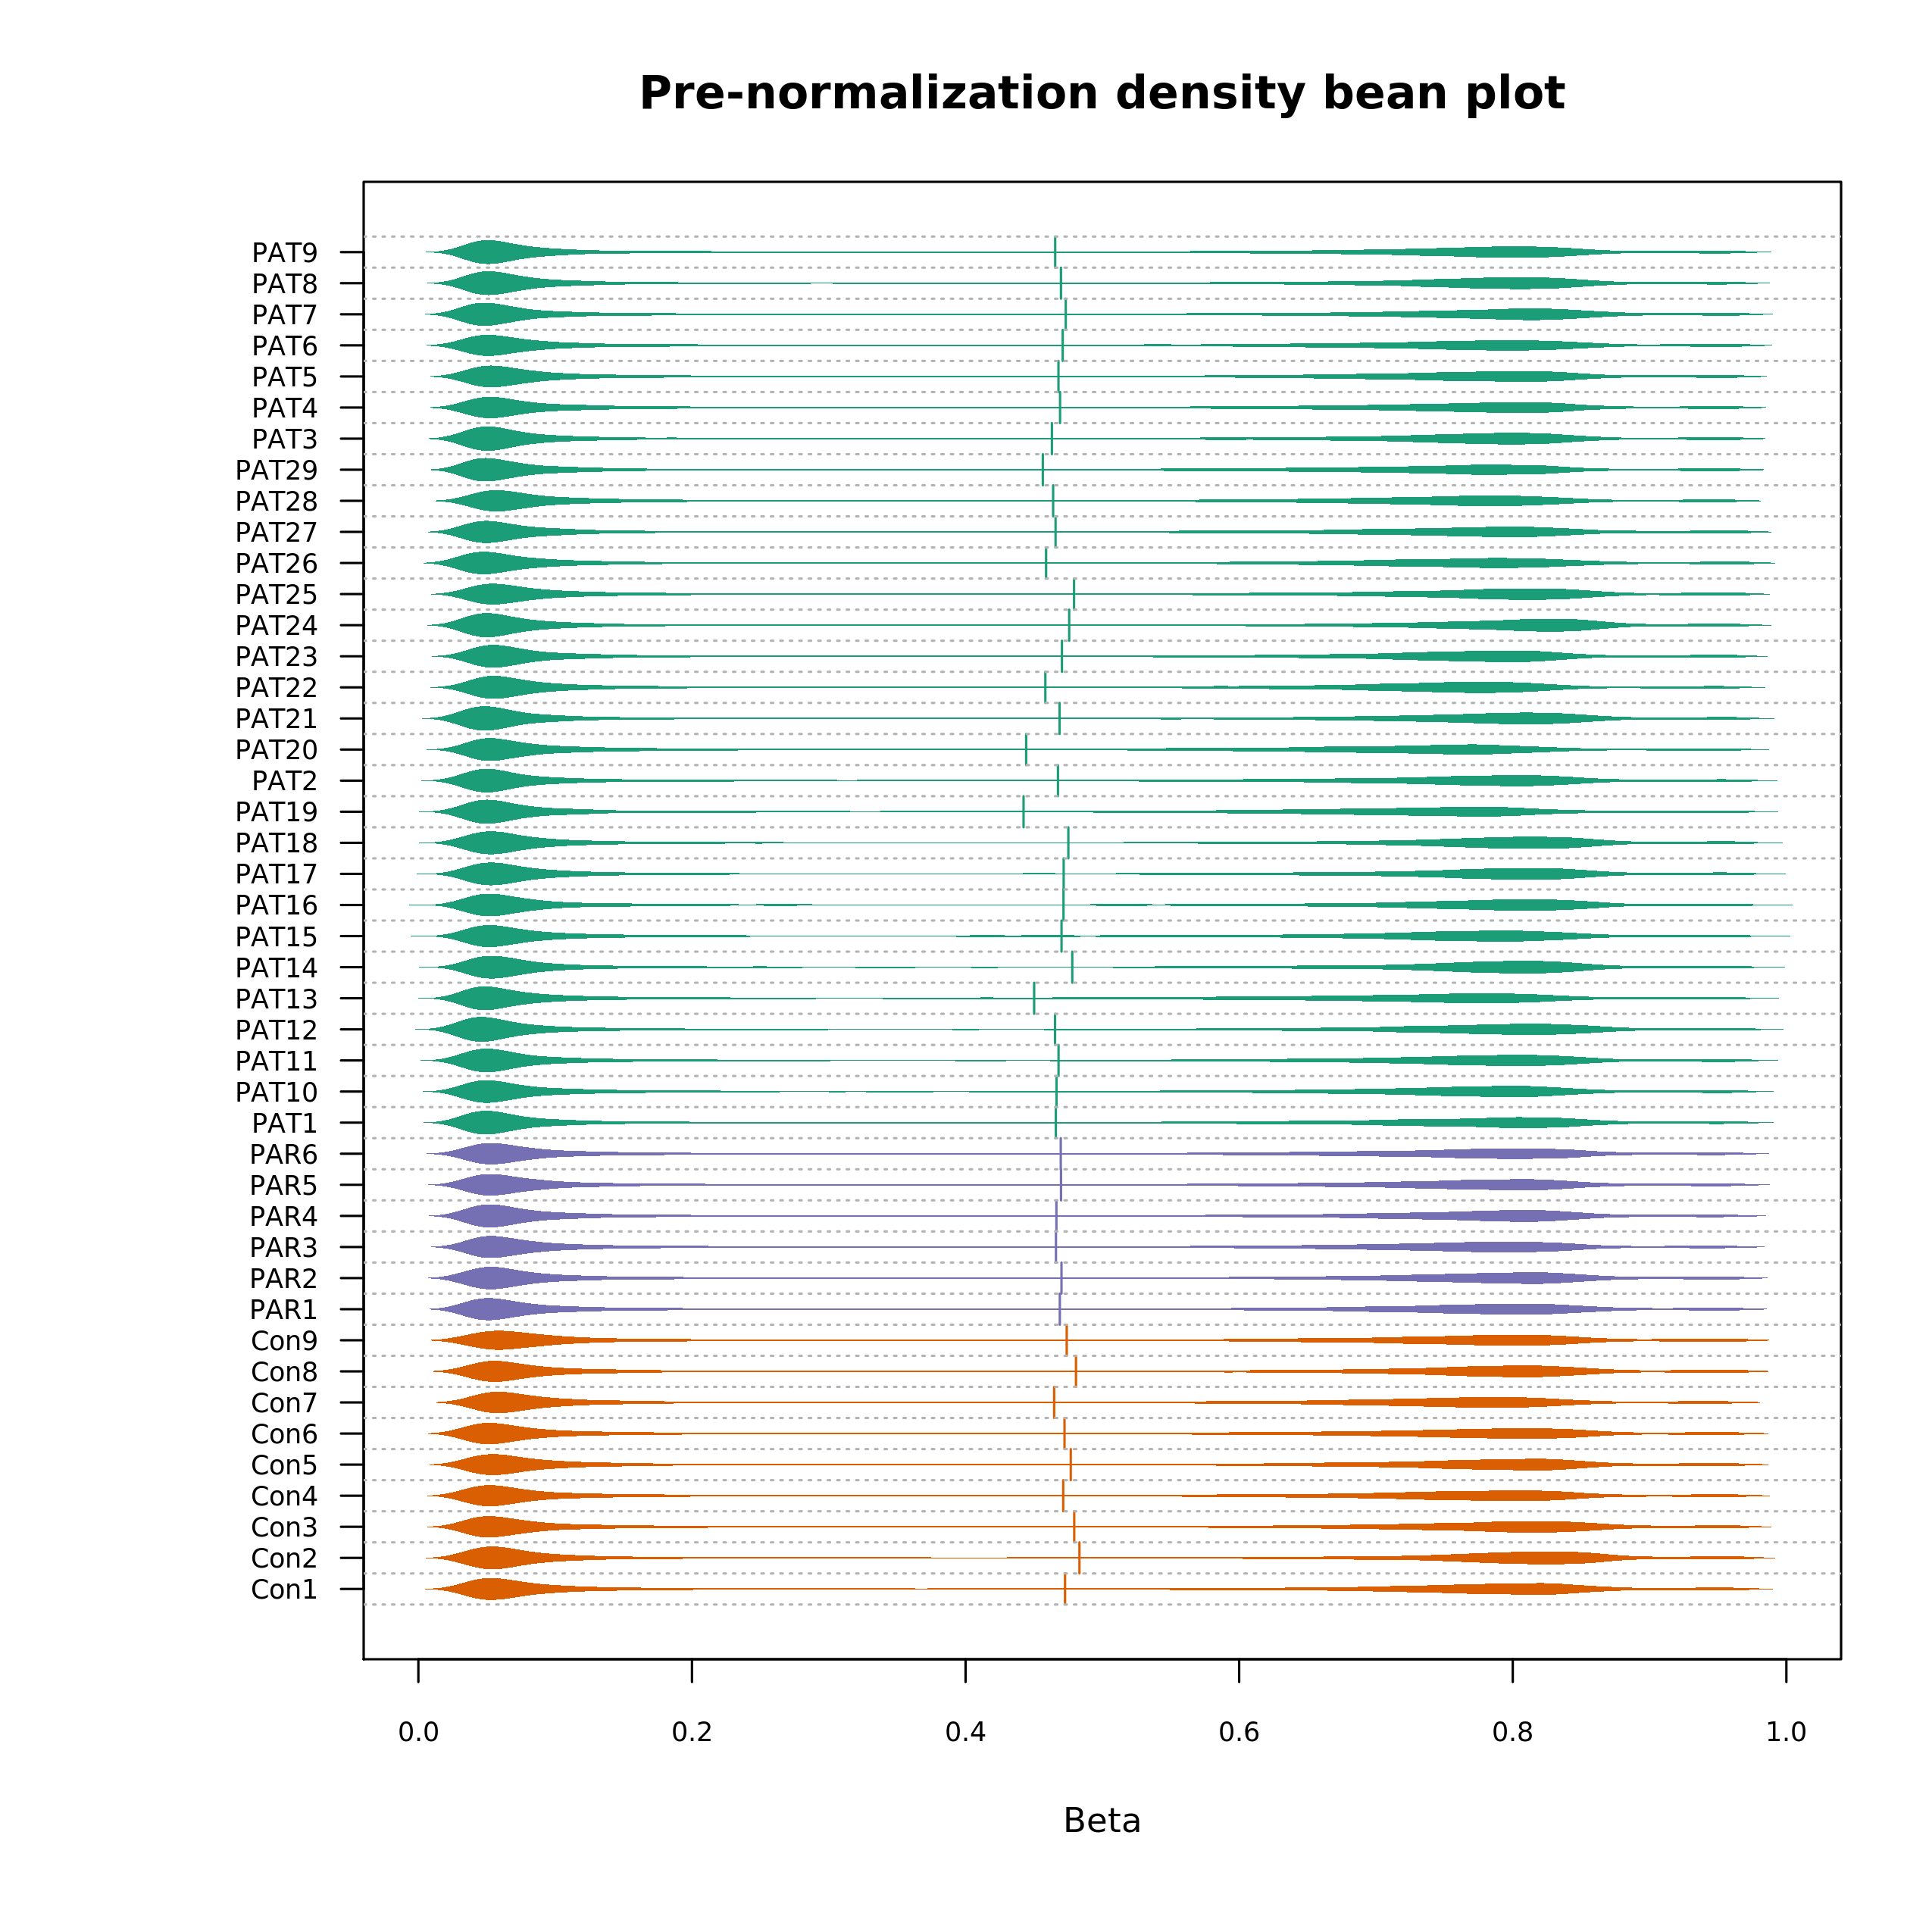
Density Bean Plot (pre-normalization)
Post-normalization density bean plot:
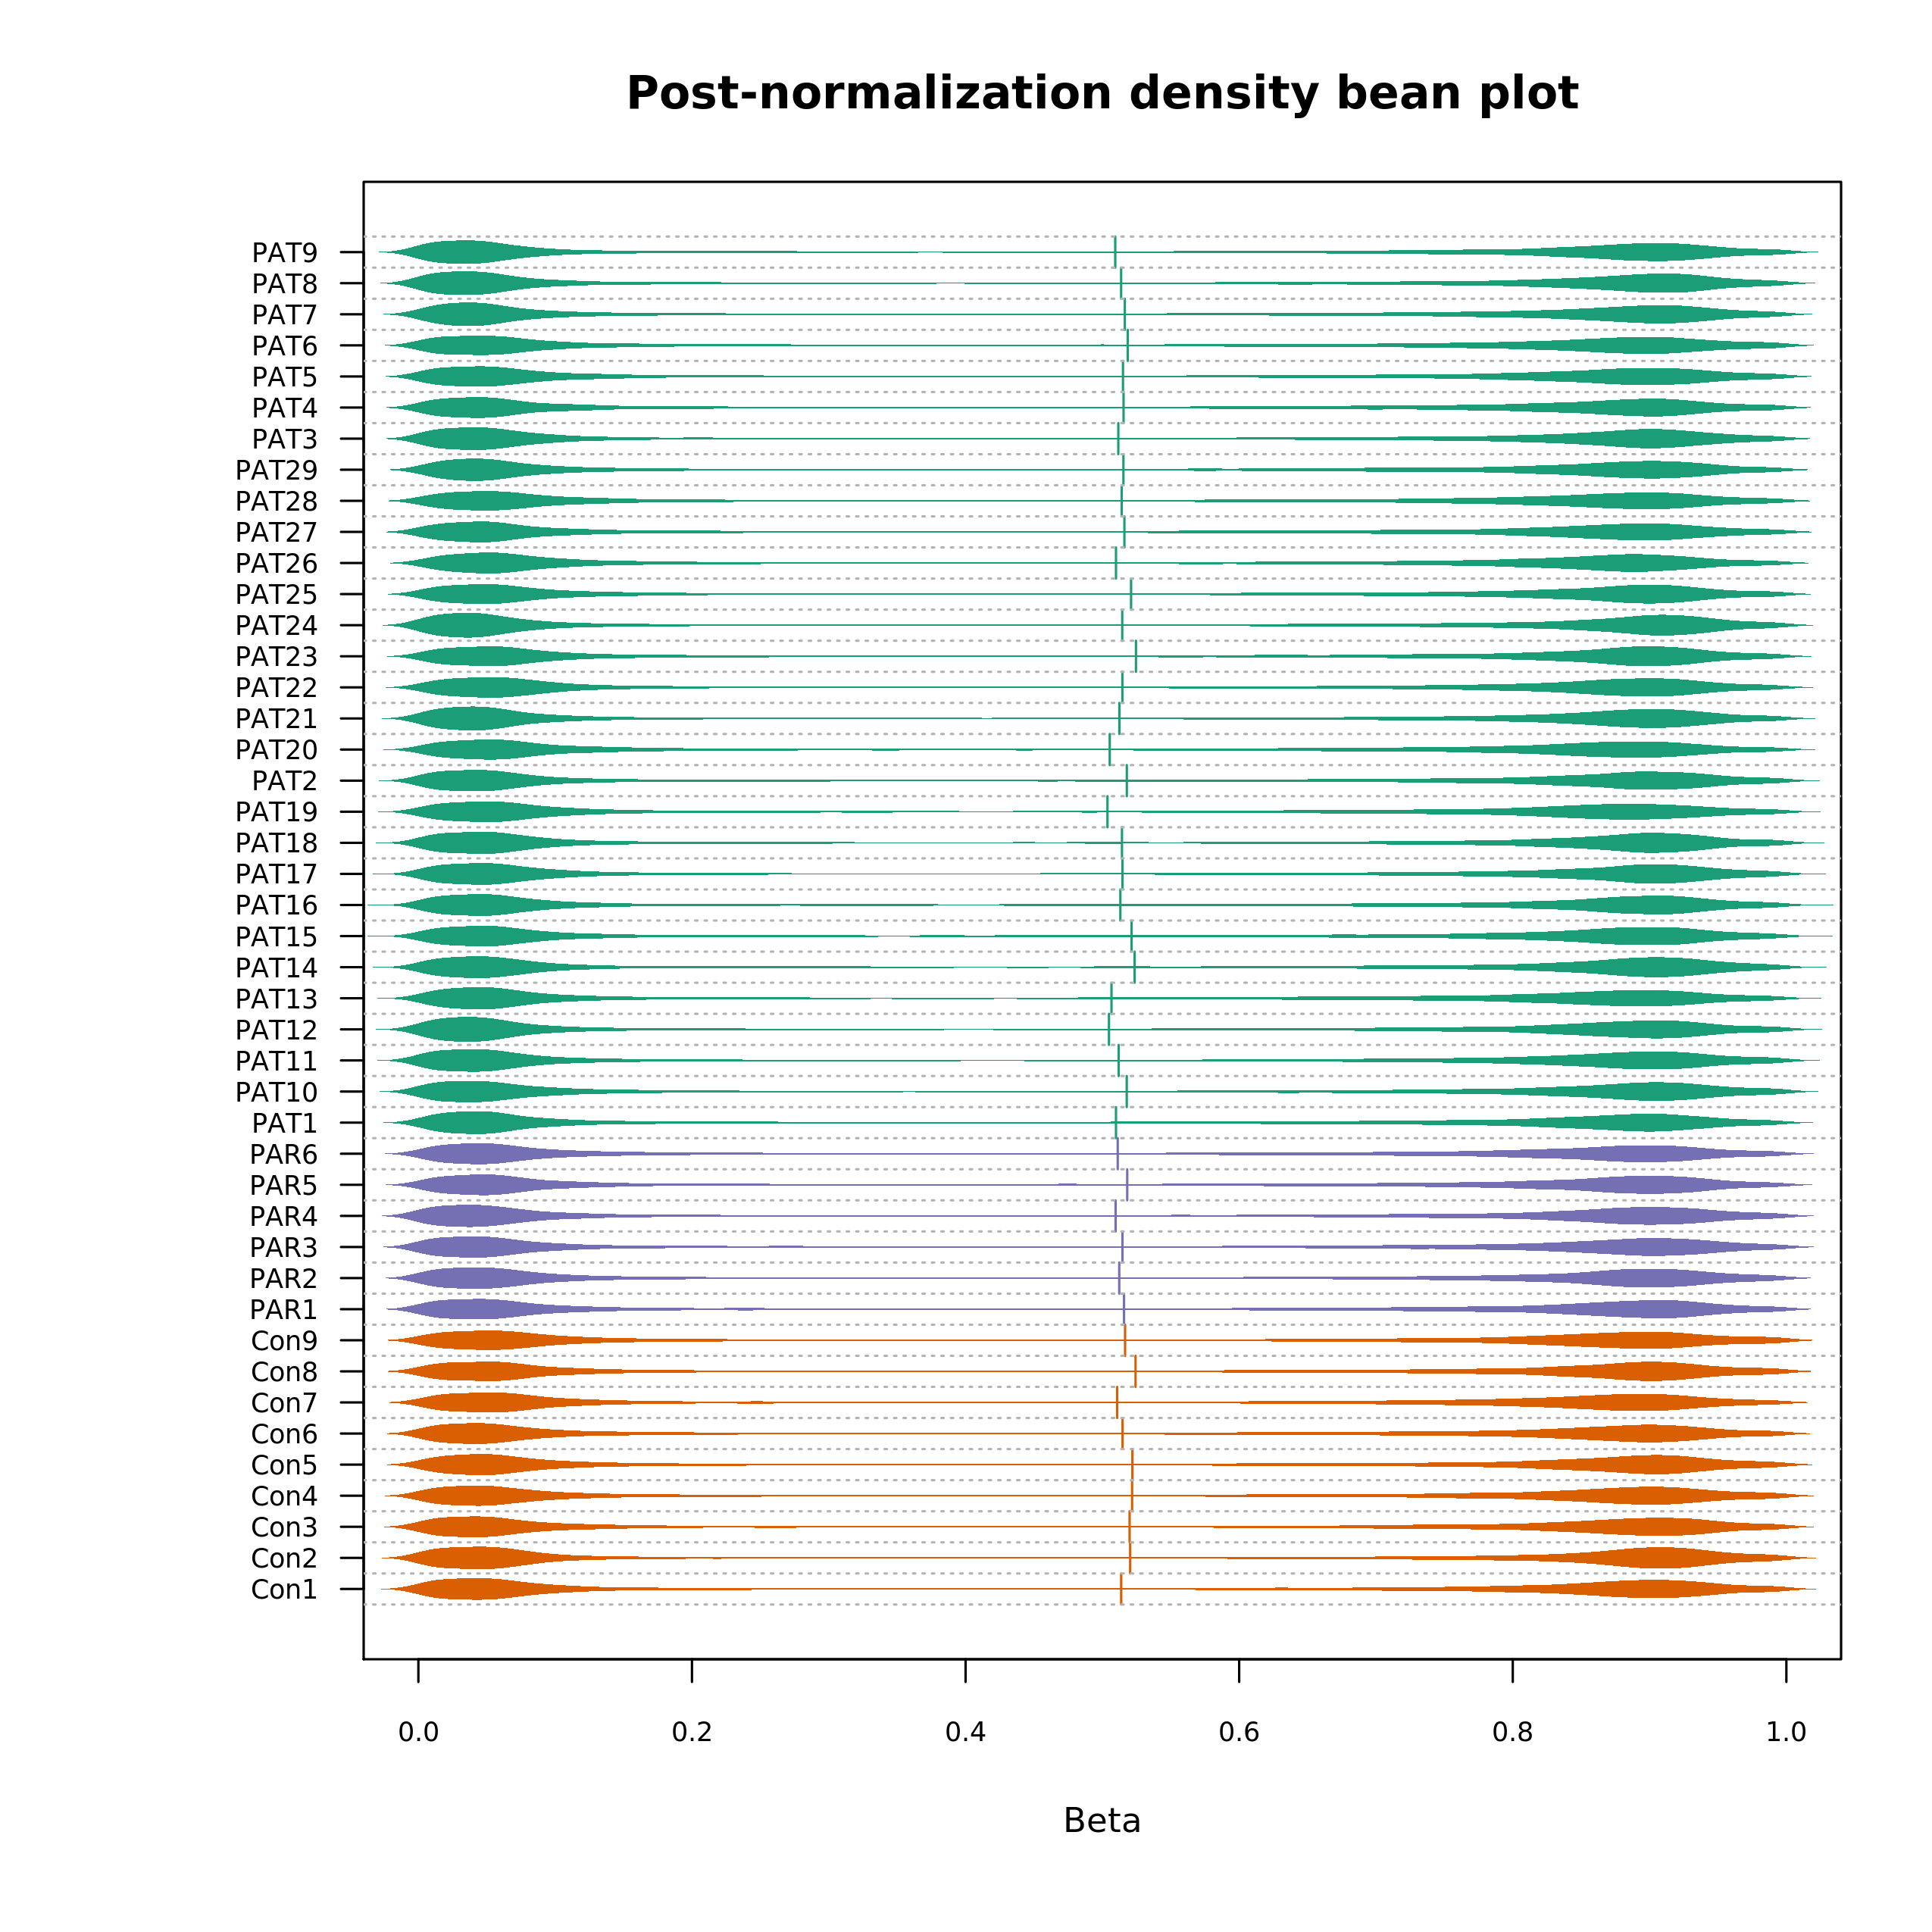
Density Bean Plot(post-normalization)
Excluded probes
The probe filtering step identifies poor quality probes and/or CpG sites in the dataset that should be excluded from downstream analysis.
Failed probes
The dataset is first filtered to exclude probes that have failed to hybridize to the array. We use the minfi function detectionP to calculate a detection p-value for each genomic location in the sample. Large p-values above the cutoff of 0.05 indicate poor quality and probes with a failure rate above the threshold 0.25 are removed. A list of the removed failed probes can be found here.
A total of 330 probes were removed.
Cross-reactive probes
Cross-reactivity occurs when a probe hybridizes not only to the targeted region but also to other regions of the genome (off-target areas). Thus, it becomes unclear which genomic region gives rise to the measured methylation status. It is recommended to remove these probes from the dataset before any subsequent analysis.
A list of cross-reactive probes for 450k data was obtained from Chen et al., 2013.
30969 cross-reactive probes in the list were removed.
Probes near single nucleotide polymorphisms excluded using minfi
SNPs were found using the minfi function getSnpInfo followed by function dropLociWithSnp to remove the SNPs from the data. A list of removed SNPs can be found here. 17541 probes were removed.
Summary
After removing the aforementioned "bad" probes, 426082 "clean" probes remain in the sample data.
Blood cell counts
The following plot shows the estimated blood cell type composition for each sample.
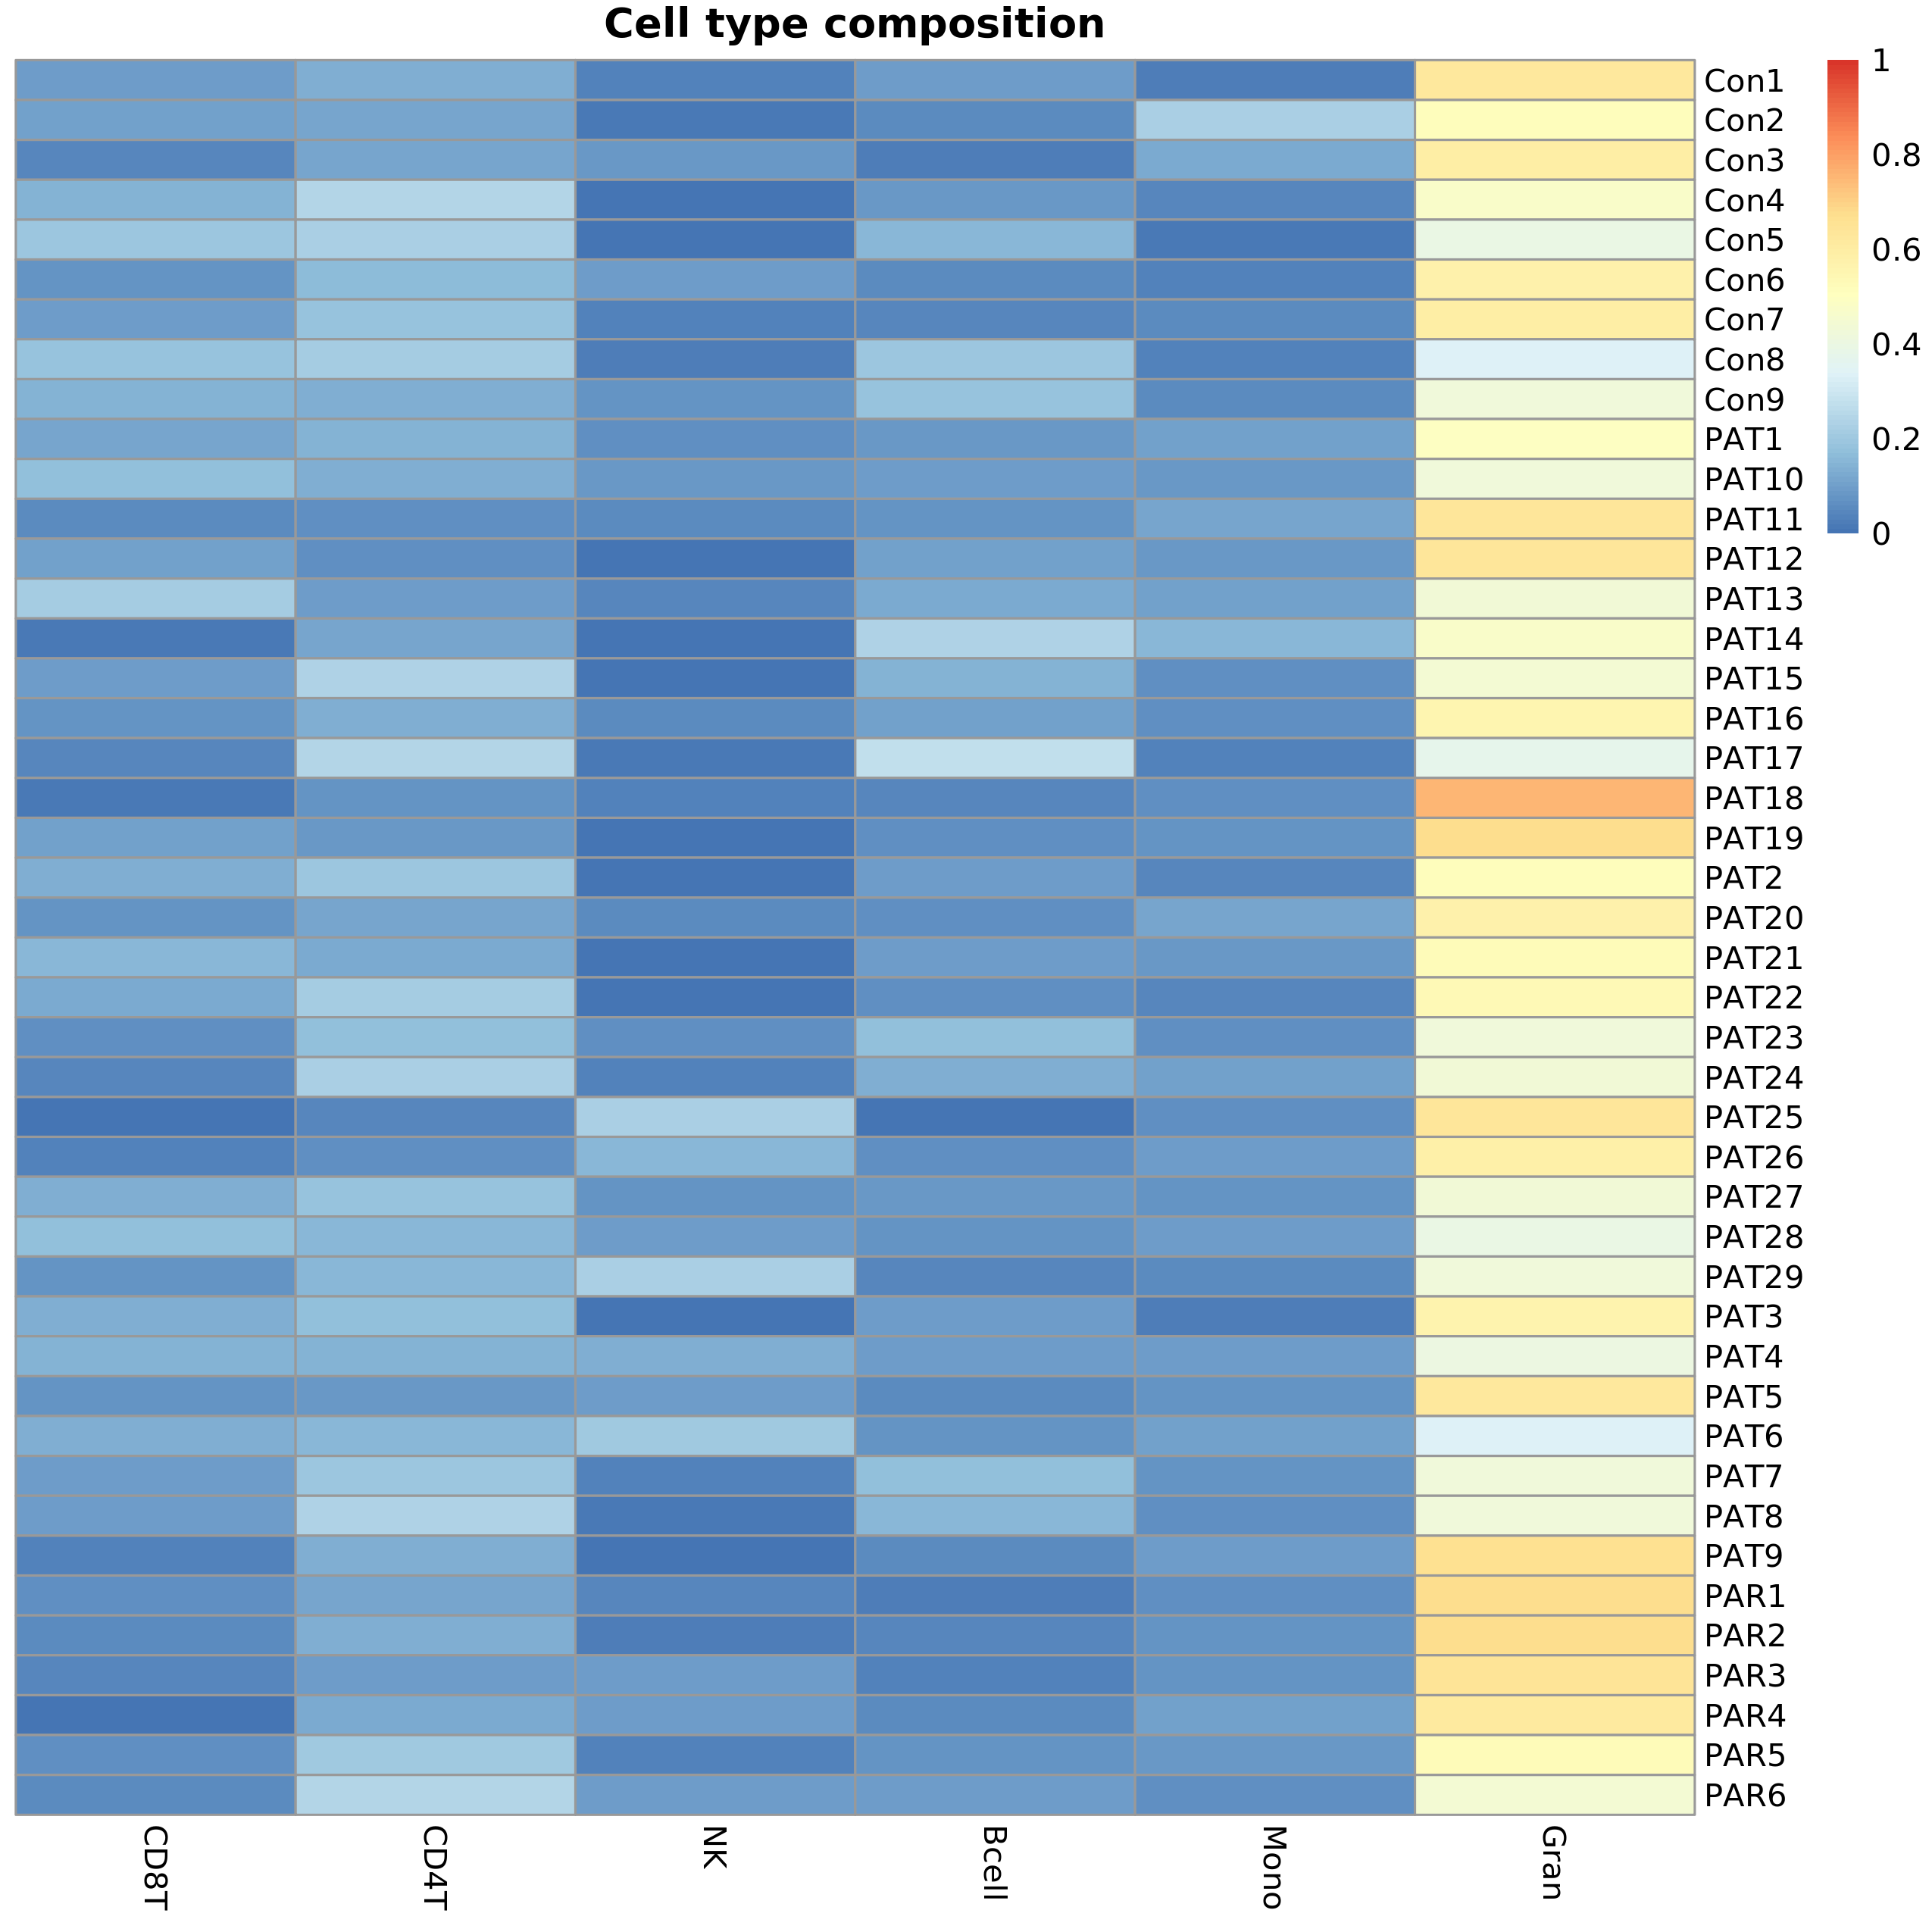
Cell type composition
| Sample Name | CD8+ T-cells | CD4+ T-cells | Natural Killer cells | B-cells | Monocytes | Granulocytes |
|---|---|---|---|---|---|---|
| Con1 | 0.0996 | 0.1359 | 0.0343 | 0.0966 | 0.0264 | 0.6234 |
| Con2 | 0.1033 | 0.1135 | 0.0109 | 0.0552 | 0.2280 | 0.5187 |
| Con3 | 0.0415 | 0.1174 | 0.0878 | 0.0263 | 0.1254 | 0.5948 |
| Con4 | 0.1448 | 0.2446 | 0.0000 | 0.0880 | 0.0499 | 0.4783 |
| Con5 | 0.2000 | 0.2279 | 0.0094 | 0.1559 | 0.0135 | 0.3994 |
| Con6 | 0.0722 | 0.1684 | 0.0970 | 0.0585 | 0.0306 | 0.5781 |
Batch effect correction
Batch effects are the systematic non-biological variations between different batches or groups of samples. They need to removed before the differential methylation analysis because presence of batch effects may confound biological differences.
Batch effects and the results of the correction can be visualized by plotting a principal analysis component (PCA) graph.
In the provided sample sheet, the batch column was specified by "" and the group column was specified by "Sample_Group". Batch correction failed. The pipeline proceeded without batch correction.
Differentially methylated positions found by minfi::dmpFinder()
DMPs were iidentified using dmpFinder() in the minfi R package.
The p-values were adjusted for multiple testing using fdr. A differentially methylated CpG is considered to be statistically significant if its p-value is lower than the significance level 0.05 and the absolute difference in DNAm between the groups exceeds the effect size threshold 0.1. The CpG sites are ordered by their adjusted p-values from the most to the least significant.
The results for each contrast can be found below:
Table for contrast KS (partial table; download full table)
Total of 17 CpG sites had significant differentially methylated positions
| CpG.Site | Avg.Case.Beta | Avg.Control.Beta | Avg.Delta.Beta | Chromosome | Gene | P.value | Adj.P.value |
|---|---|---|---|---|---|---|---|
| cg05905531 | 0.6097 | 0.8385 | 0.2289 | chr19 | MYO1F | 0.0000 | 0.0003 |
| cg08283130 | 0.5076 | 0.8441 | 0.3365 | chr19 | MYO1F | 0.0000 | 0.0003 |
| cg15254671 | 0.4886 | 0.8568 | 0.3682 | chr19 | MYO1F | 0.0000 | 0.0003 |
| cg22568423 | 0.4774 | 0.7997 | 0.3223 | chr19 | MYO1F | 0.0000 | 0.0018 |
| cg22987448 | 0.4508 | 0.8523 | 0.4015 | chr19 | MYO1F | 0.0000 | 0.0018 |
| cg11683663 | 0.7890 | 0.9378 | 0.1488 | chr19 | ELANE | 0.0000 | 0.0129 |
- Cpg Site: site of CpG region
- Avg Case Beta: average methylation of case (sample or Mut)
- Avg Control Beta: average methylation of control (WT)
- Avg Delta Beta: average methylation difference (ie. Avg Case Beta - Avg Control Beta)
- Chromosome: chromosomal position
- Gene: gene where CpG site is found
- P-value: raw pvalue (pvalue before adjustment)
- Adj.P-value: pvalue after adjustment
Differentially methylated positions found by limma regression
DMPs were identified using regression analysis implemented in limma package, with the following confounding factors: Sex,CellCounts.Gran
The p-values were adjusted for multiple testing using fdr. A differentially methylated CpG is considered to be statistically significant if its p-value is lower than the significance level 0.05 and the absolute difference in DNAm between the groups exceeds the effect size threshold 0.1. The CpG sites are ordered by their adjusted p-values from the most to the least significant.
The results for each contrast can be found below:
Table for contrast KS (partial table; download full table)
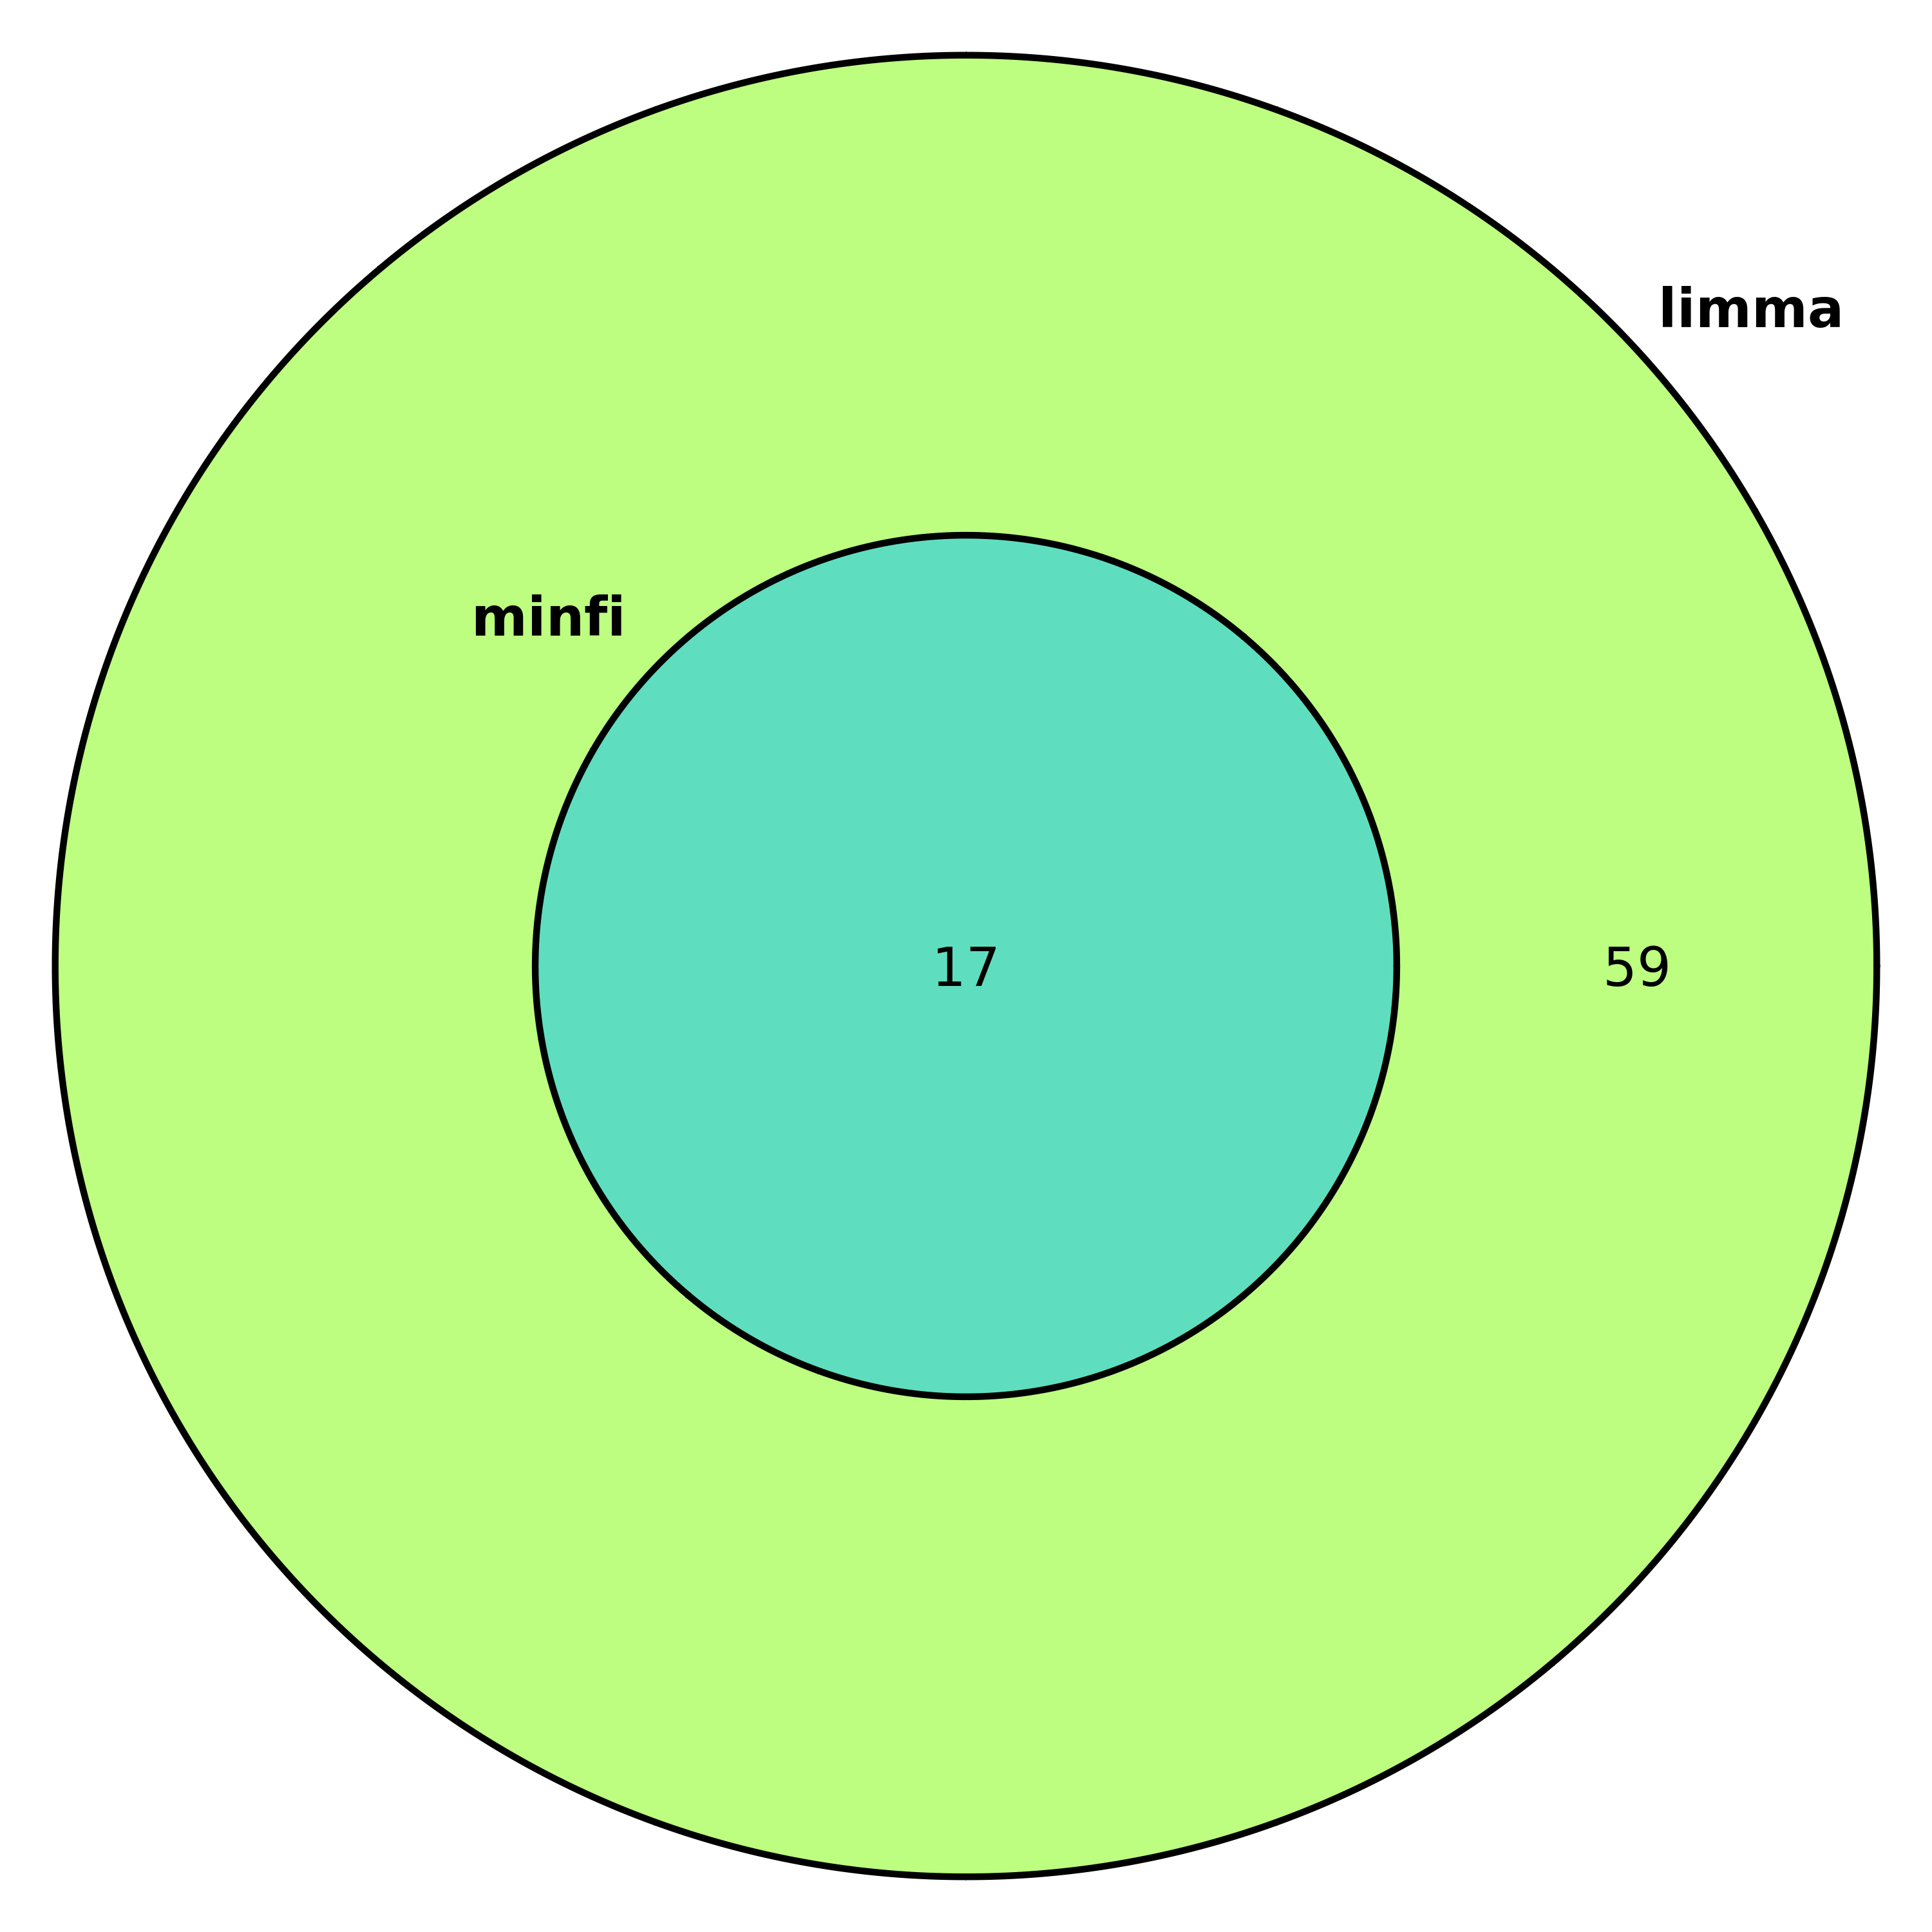
Total of 76 CpG sites had significant differentially methylated positions
| CpG.Site | Avg.Case.Beta | Avg.Control.Beta | Avg.Delta.Beta | Chromosome | Gene | P.value | Adj.P.value |
|---|---|---|---|---|---|---|---|
| cg05905531 | 0.6097 | 0.8385 | 0.2289 | chr19 | MYO1F | 0.0000 | 0.0006 |
| cg08283130 | 0.5076 | 0.8441 | 0.3365 | chr19 | MYO1F | 0.0000 | 0.0006 |
| cg15254671 | 0.4886 | 0.8568 | 0.3682 | chr19 | MYO1F | 0.0000 | 0.0006 |
| cg01290904 | 0.4742 | 0.6102 | 0.1360 | chr4 | EVC2 | 0.0000 | 0.0014 |
| cg22568423 | 0.4774 | 0.7997 | 0.3223 | chr19 | MYO1F | 0.0000 | 0.0014 |
| cg22987448 | 0.4508 | 0.8523 | 0.4015 | chr19 | MYO1F | 0.0000 | 0.0014 |
- Cpg Site: site of CpG region
- Avg Case Beta: average methylation of case (sample or Mut)
- Avg Control Beta: average methylation of control (WT)
- Avg Delta Beta: average methylation difference (ie. Avg Case Beta - Avg Control Beta)
- Chromosome: chromosomal position
- Gene: gene where CpG site is found
- P-value: raw pvalue (pvalue before adjustment)
- Adj.P-value: pvalue after adjustment
Differentially methylated positions found by Mann-Whitney U-test
DMPs were identified using the non-parametric Mann-Whitney U-test.
The p-values were adjusted for multiple testing using fdr. A differentially methylated CpG is considered to be statistically significant if its p-value is lower than the significance level 0.05 and the absolute difference in DNAm between the groups exceeds the effect size threshold 0.1. The CpG sites are ordered by their adjusted p-values from the most to the least significant.
The results for each contrast can be found below:
Table for contrast KS (partial table; download full table)
Total of 0 CpG sites had significant differentially methylated positions
- Cpg Site: site of CpG region
- Avg Case Beta: average methylation of case (sample or Mut)
- Avg Control Beta: average methylation of control (WT)
- Avg Delta Beta: average methylation difference (ie. Avg Case Beta - Avg Control Beta)
- Chromosome: chromosomal position
- Gene: gene where CpG site is found
- P-value: raw pvalue (pvalue before adjustment)
- Adj.P-value: pvalue after adjustment
Differentially methylated positions identified by the interesection of all specified selection methods
The results for each contrast can be found below:
Table for contrast KS (partial table; download full table)
Total of 17 CpG sites had significant differentially methylated positions
| CpG.Site | Avg.Case.Beta | Avg.Control.Beta | Avg.Delta.Beta | Chromosome | Gene | P.value | Adj.P.value |
|---|---|---|---|---|---|---|---|
| cg05905531 | 0.6097 | 0.8385 | 0.2289 | chr19 | MYO1F | 0.0000 | 0.0003 |
| cg08283130 | 0.5076 | 0.8441 | 0.3365 | chr19 | MYO1F | 0.0000 | 0.0003 |
| cg15254671 | 0.4886 | 0.8568 | 0.3682 | chr19 | MYO1F | 0.0000 | 0.0003 |
| cg22568423 | 0.4774 | 0.7997 | 0.3223 | chr19 | MYO1F | 0.0000 | 0.0018 |
| cg22987448 | 0.4508 | 0.8523 | 0.4015 | chr19 | MYO1F | 0.0000 | 0.0018 |
| cg11683663 | 0.7890 | 0.9378 | 0.1488 | chr19 | ELANE | 0.0000 | 0.0129 |
- Cpg Site: site of CpG region
- Avg Case Beta: average methylation of case (sample or Mut)
- Avg Control Beta: average methylation of control (WT)
- Avg Delta Beta: average methylation difference (ie. Avg Case Beta - Avg Control Beta)
- Chromosome: chromosomal position
- Gene: gene where CpG site is found
- P-value: raw pvalue (pvalue before adjustment)
- Adj.P-value: pvalue after adjustment
Venn diagrams
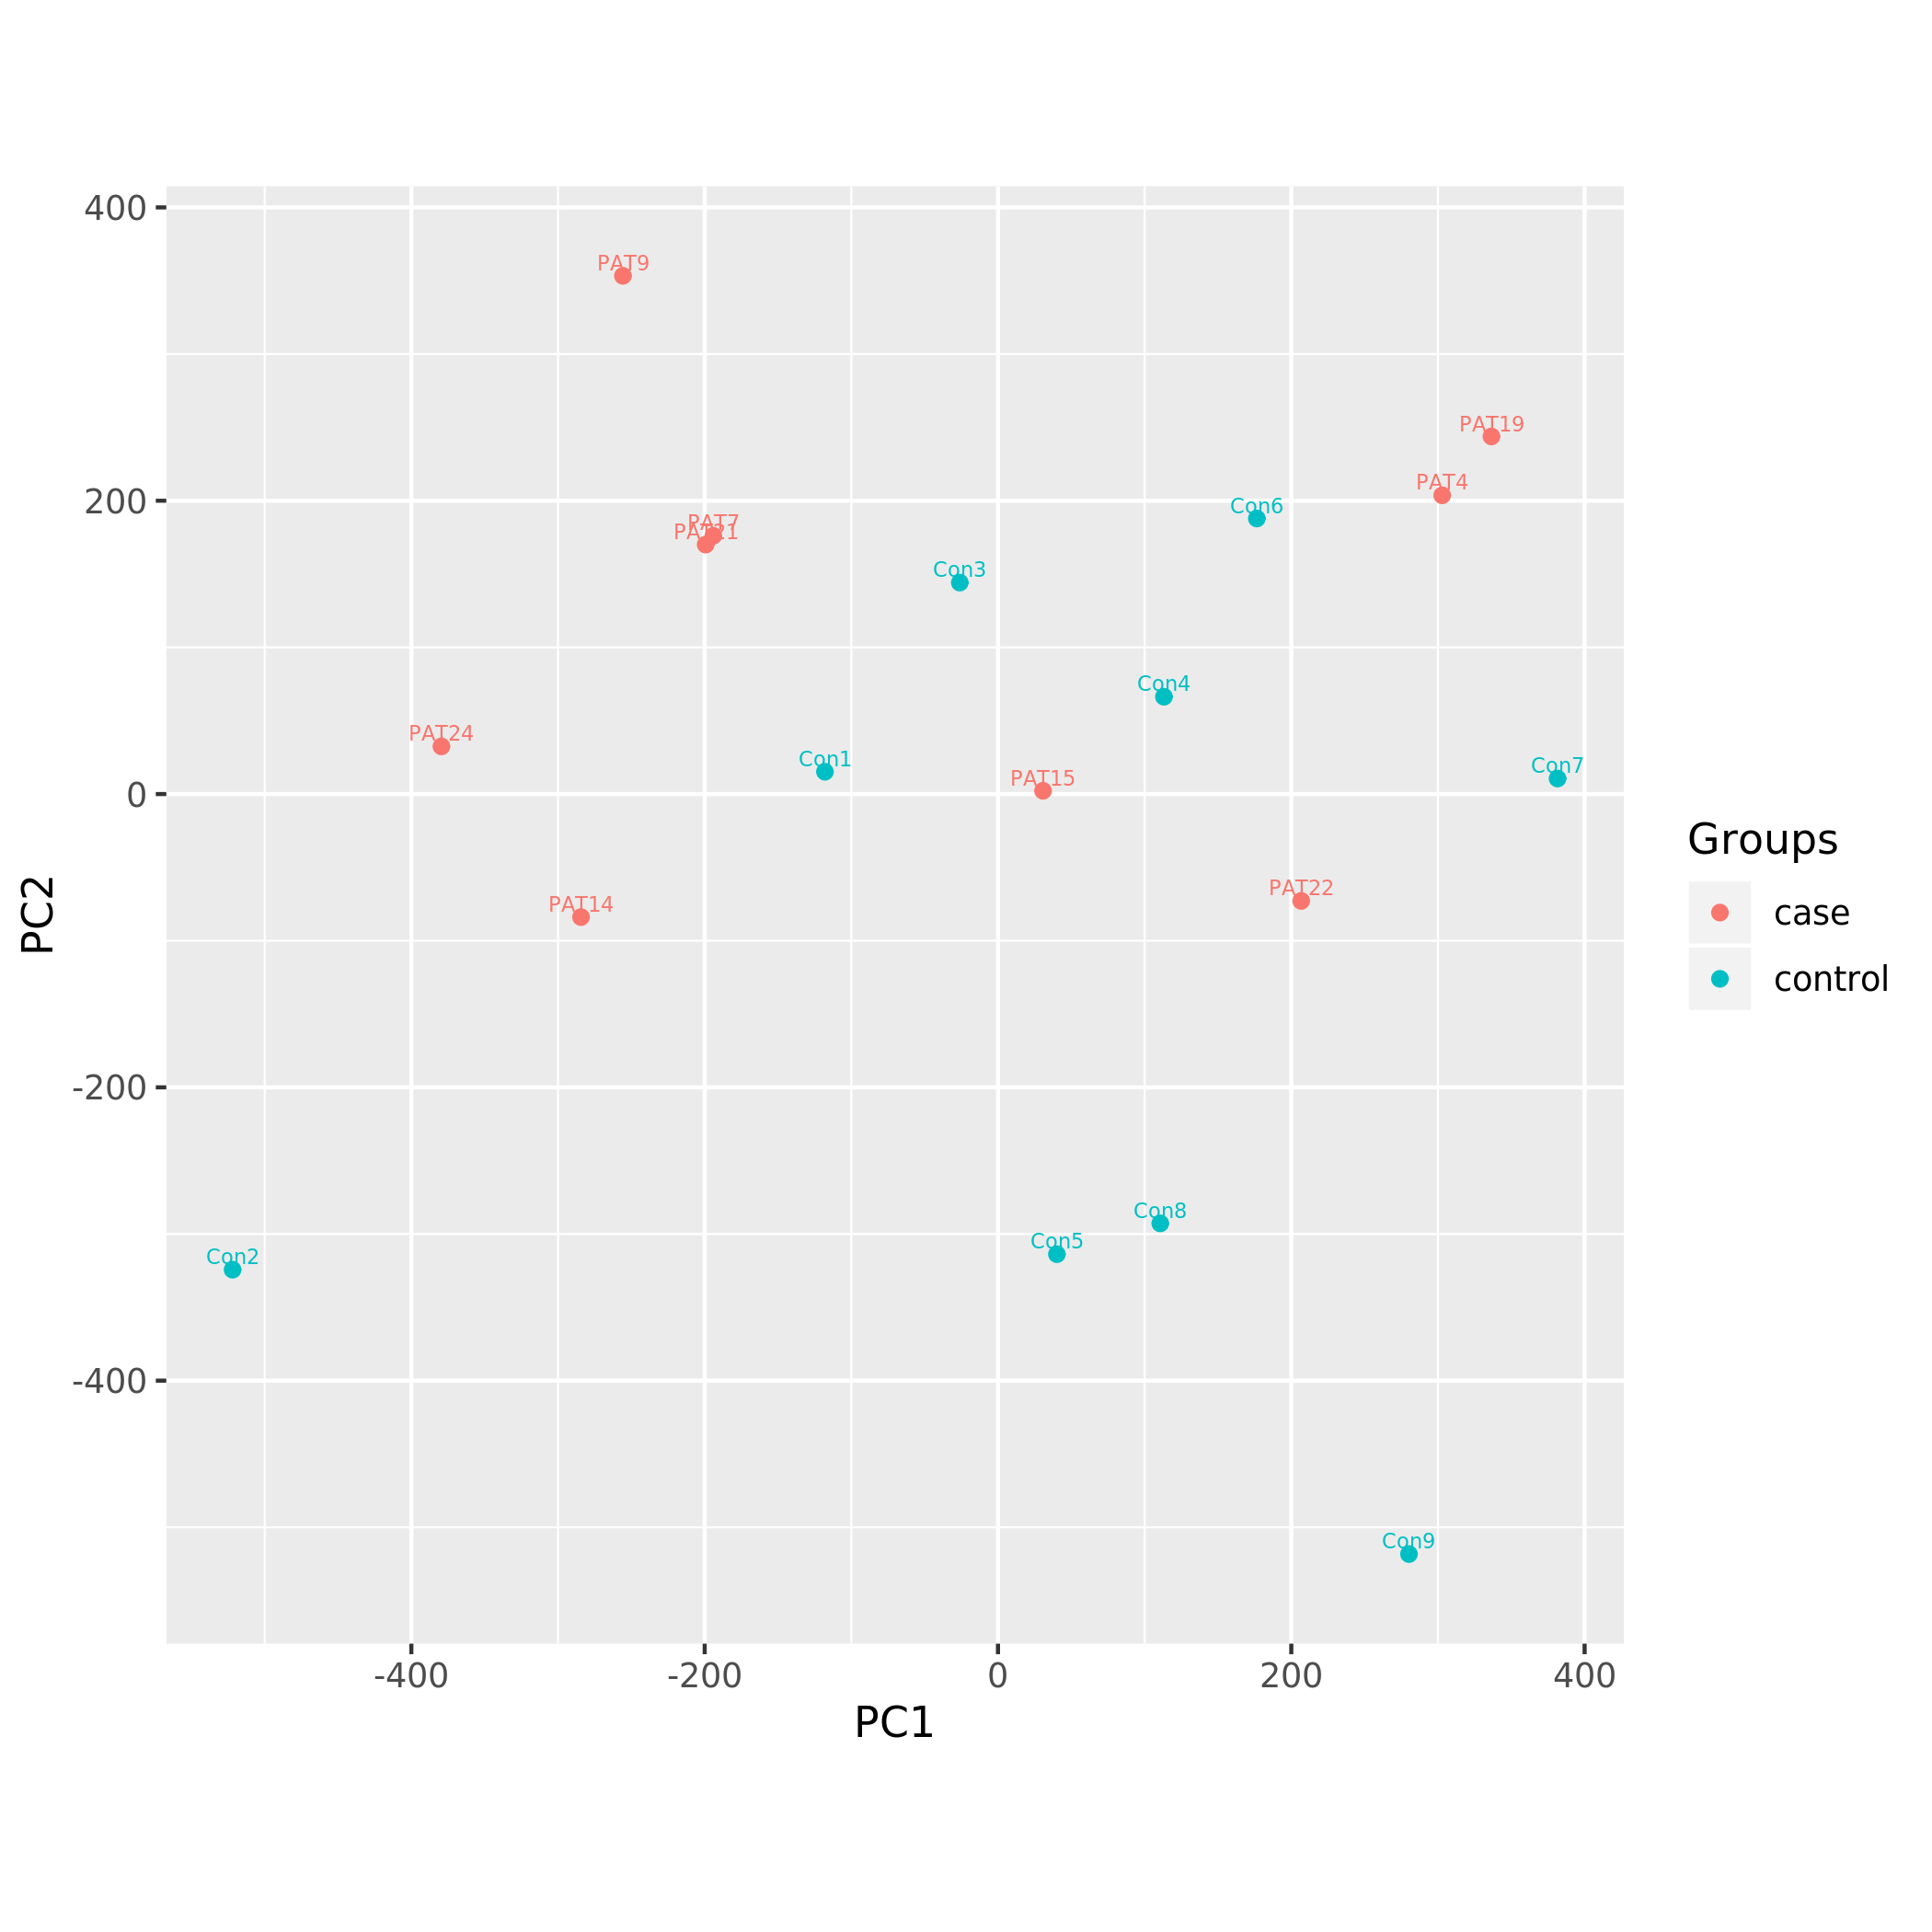
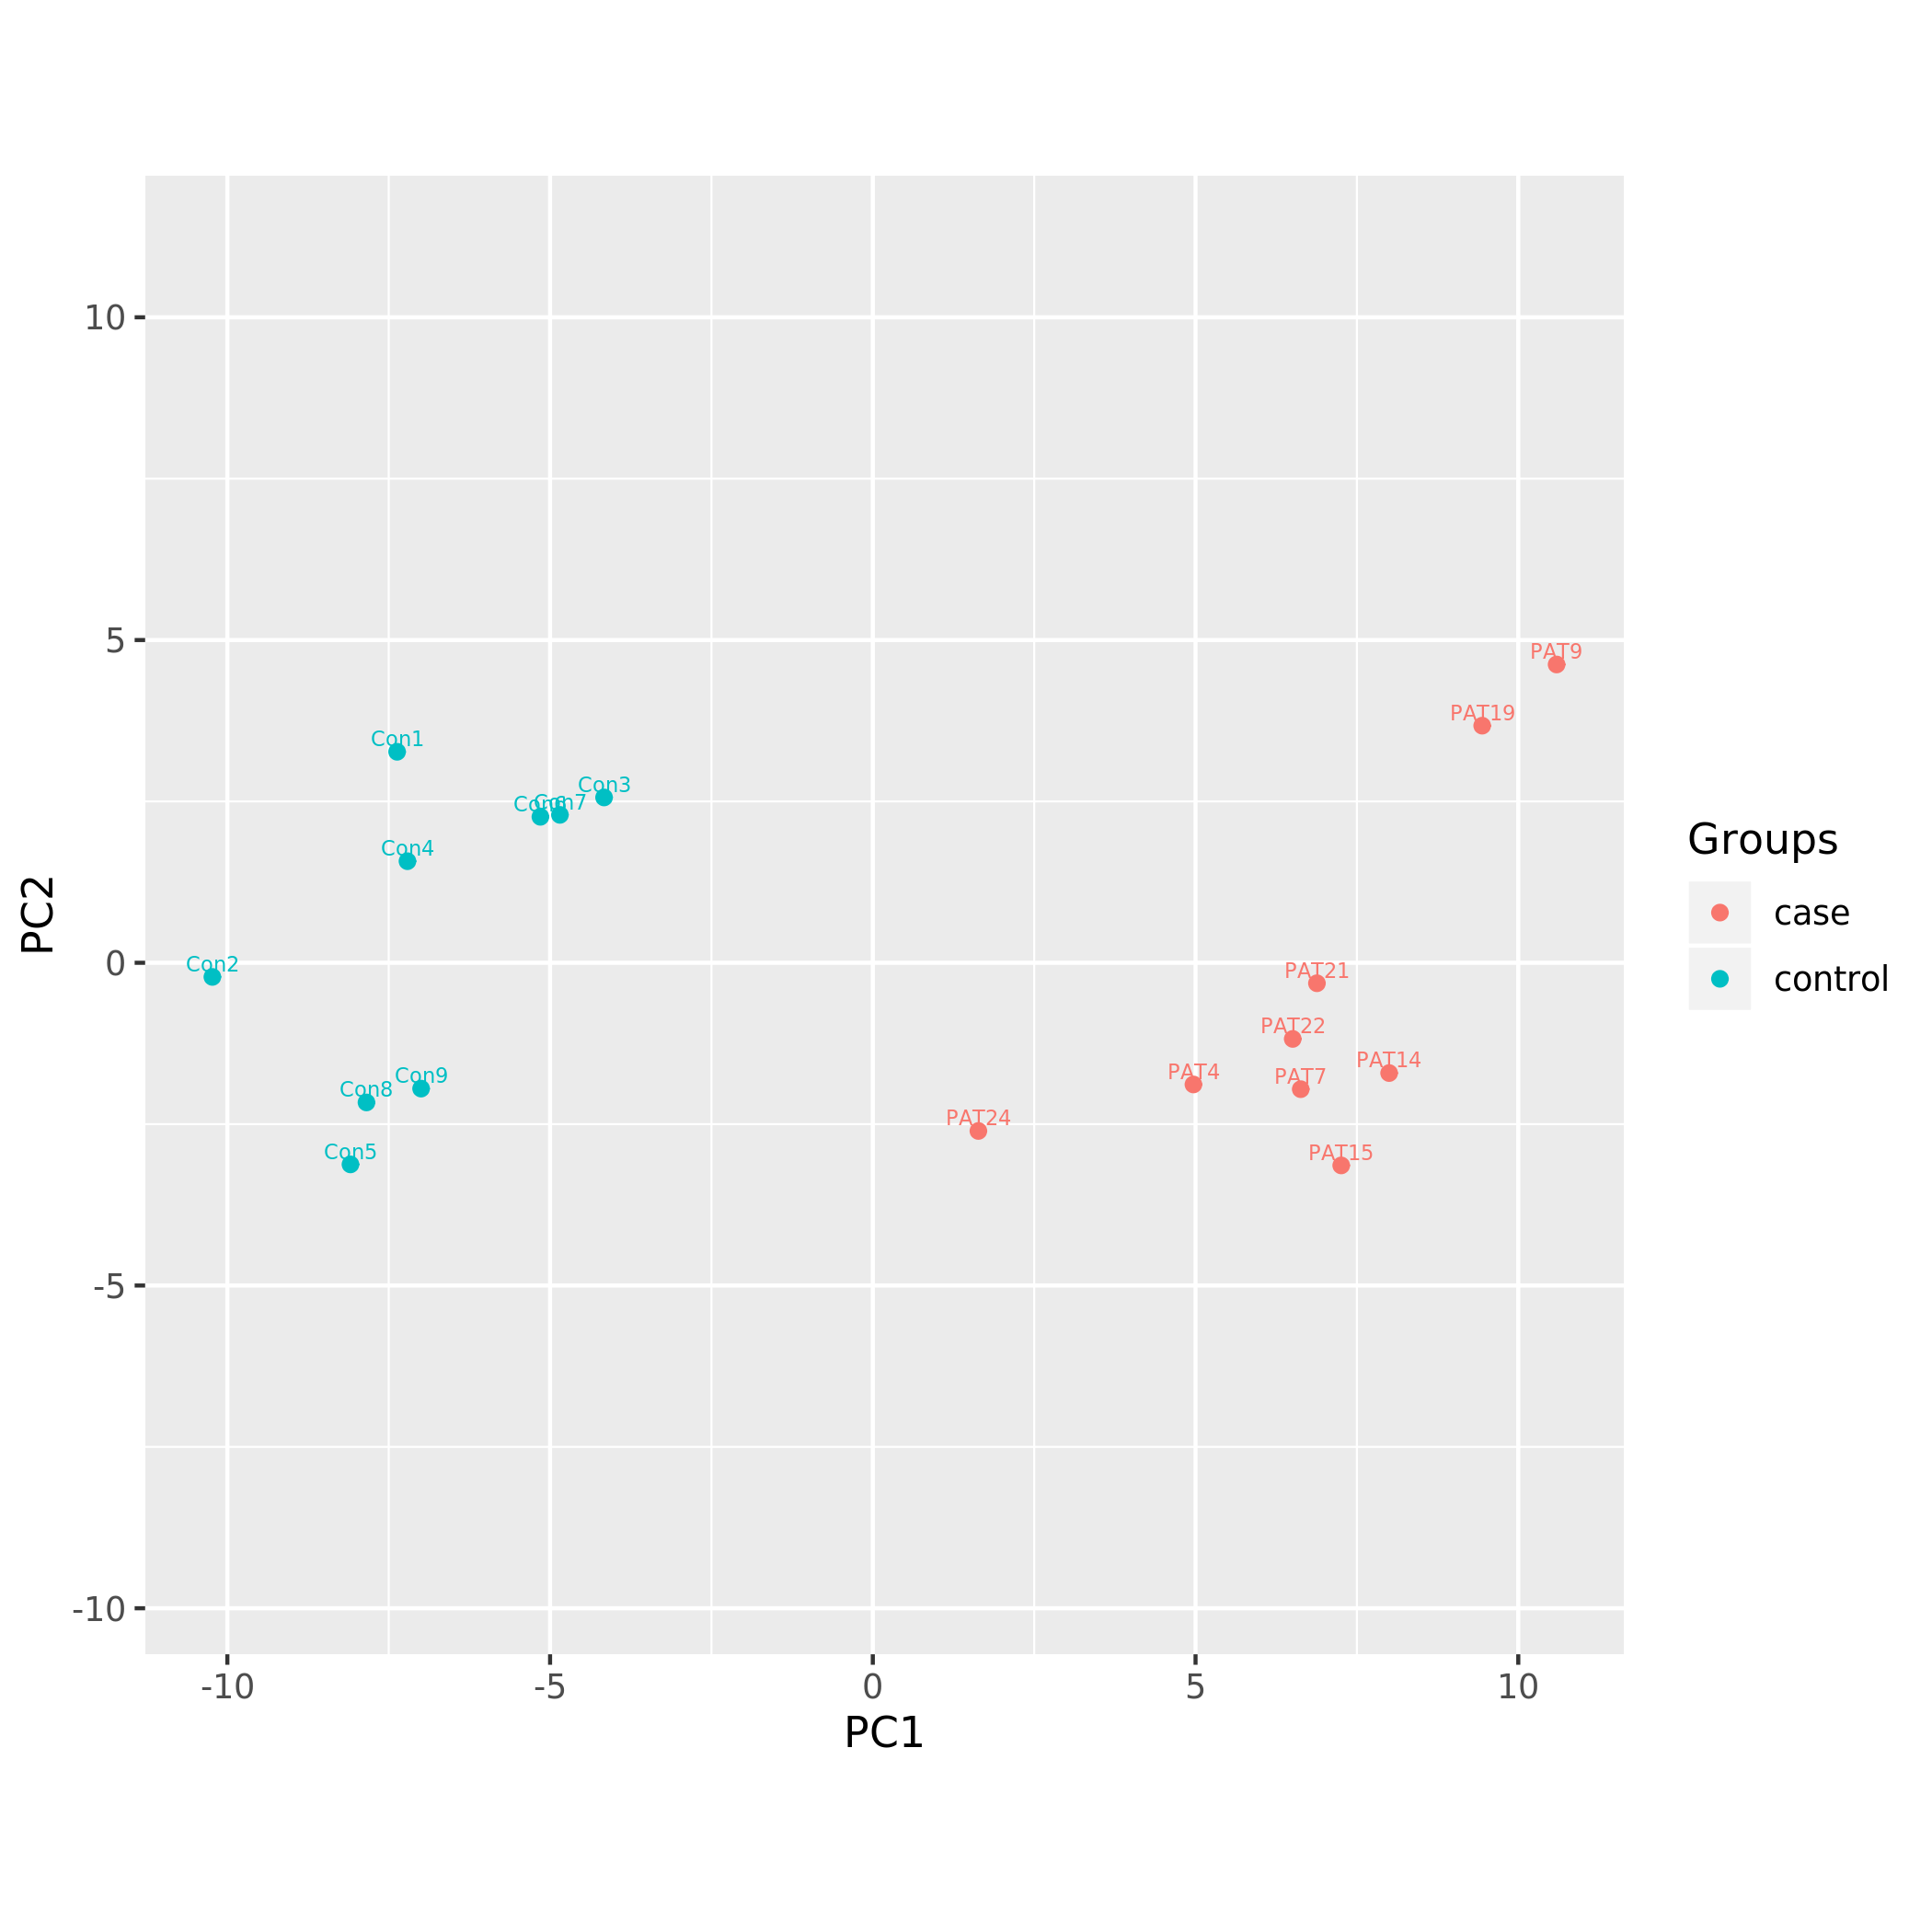
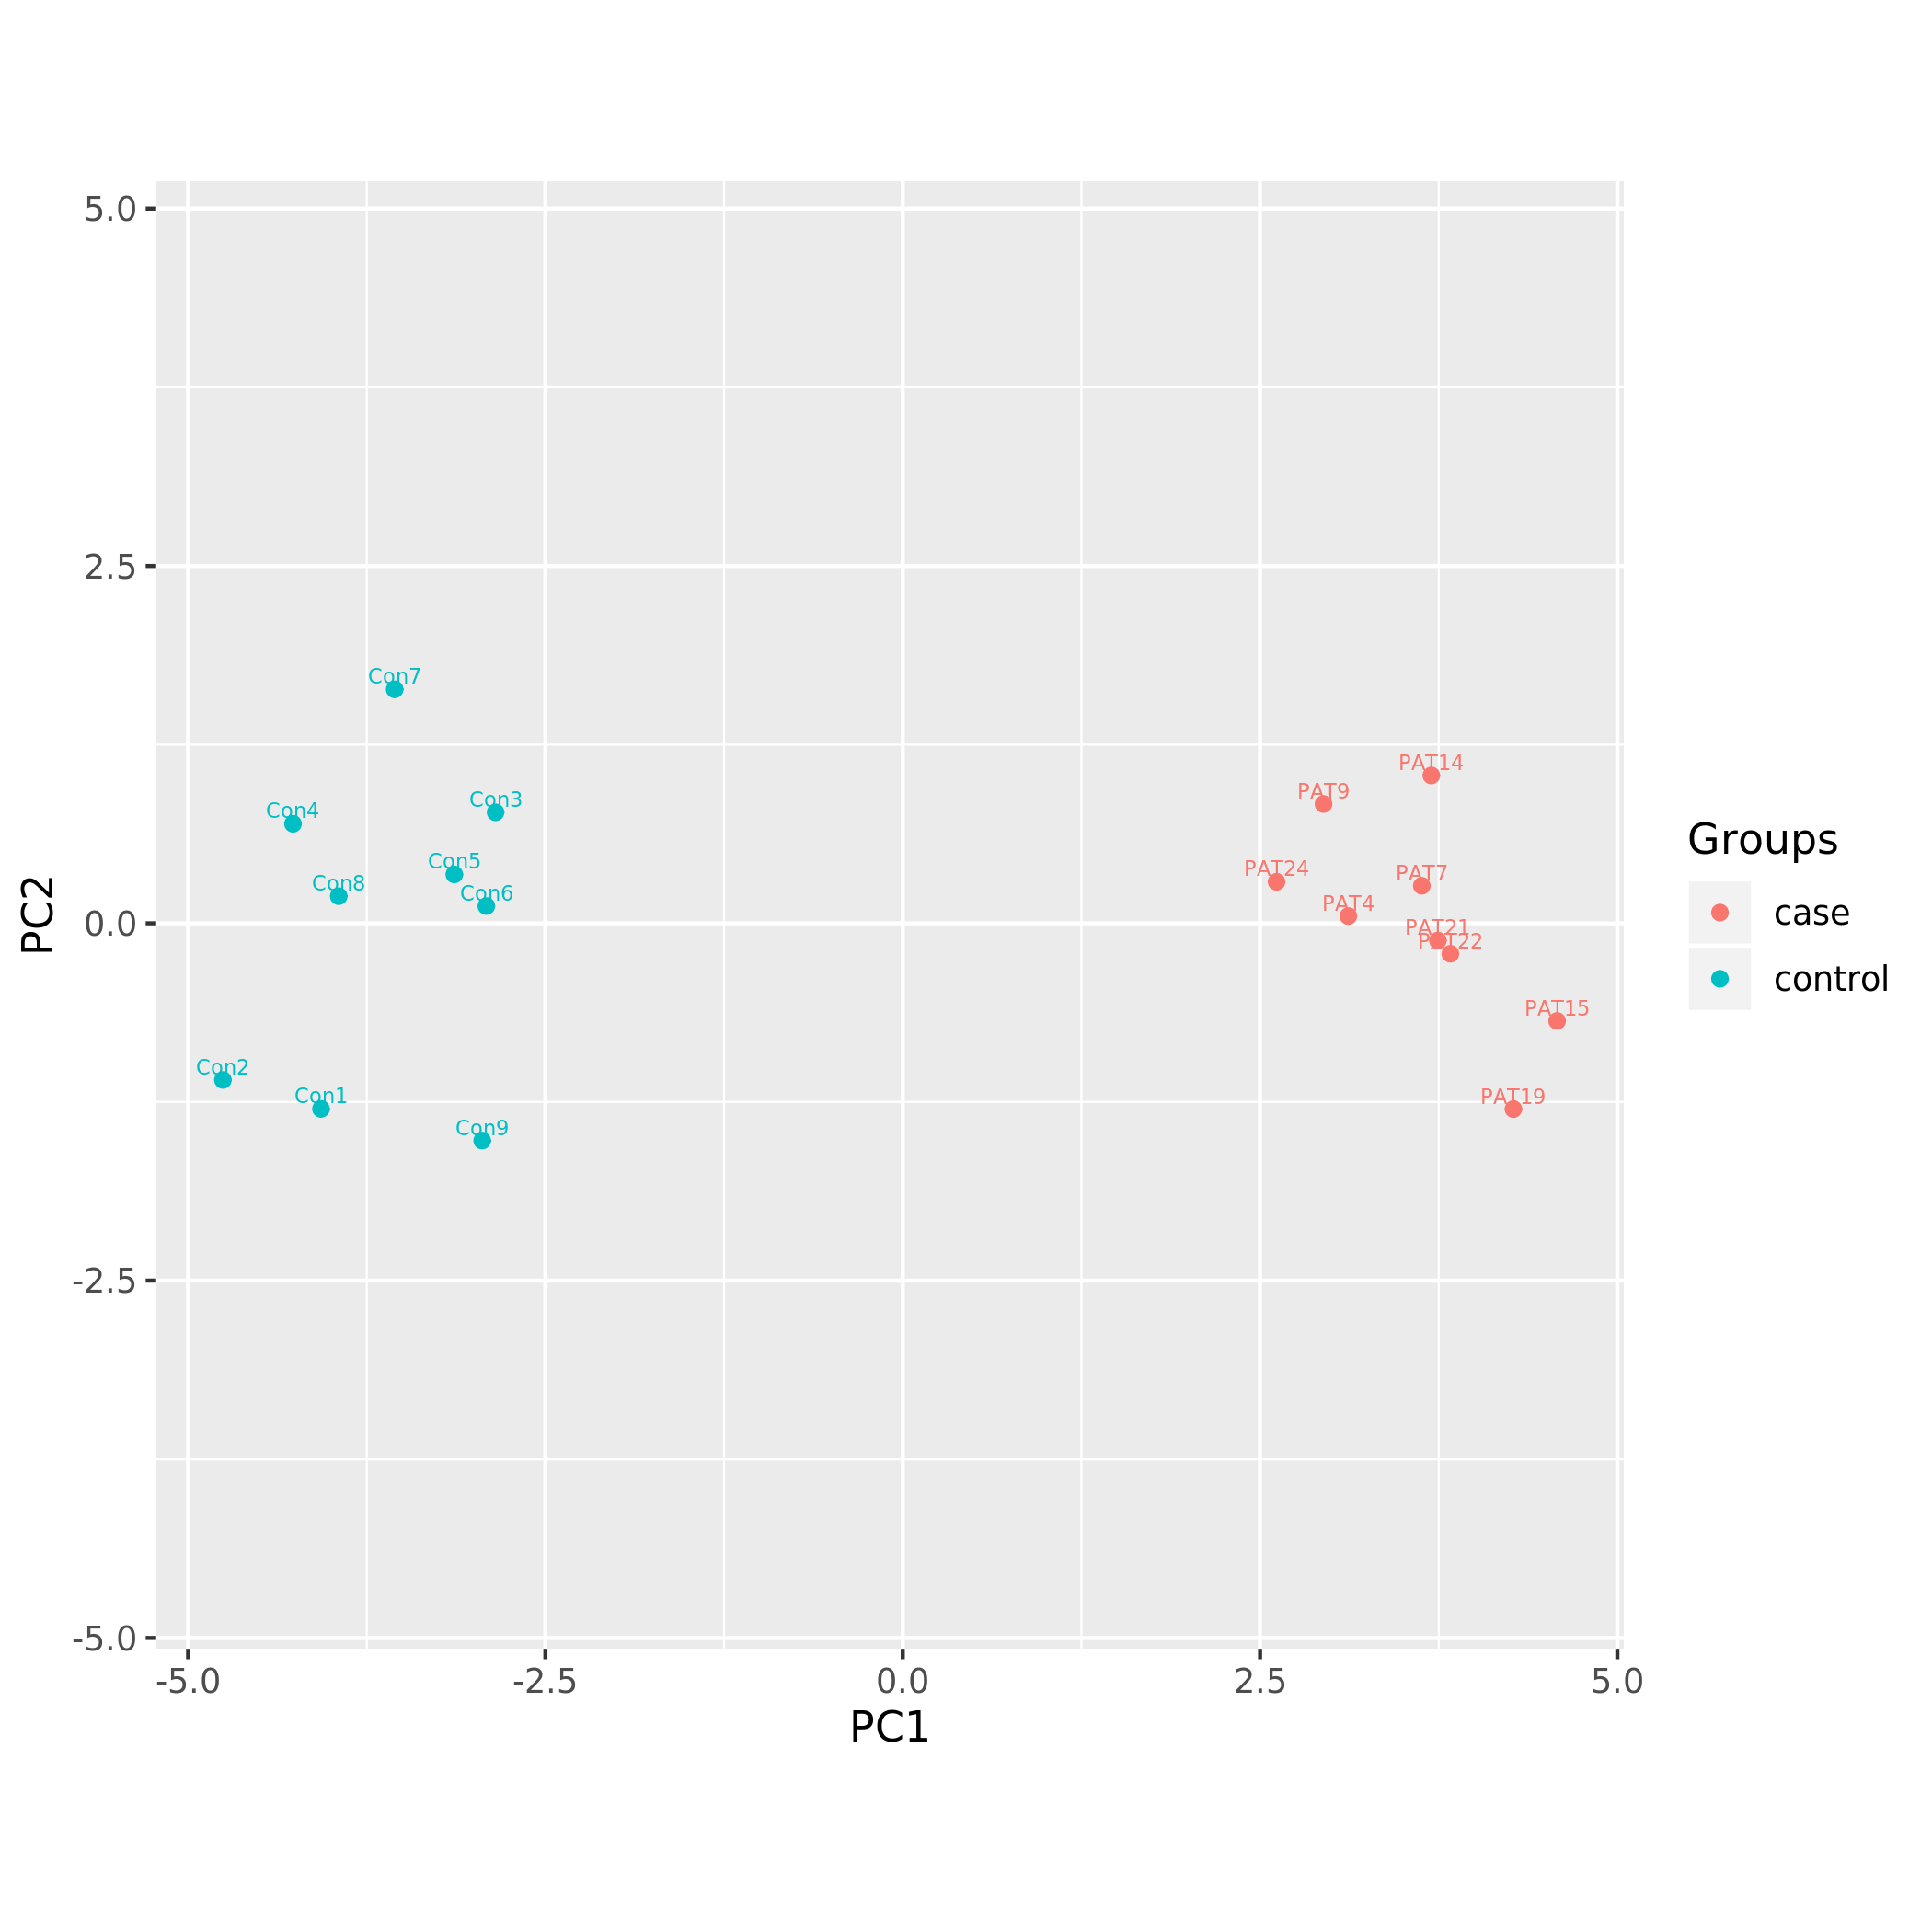
Principal component analysis plots
Following PCA plots were generated:
KS_PCA using all CpGs after normalization.png
KS_PCA using all CpGs after normalization.png
KS_PCA using limma DNAm signature.png
KS_PCA using limma DNAm signature.png
KS_PCA using minfi DNAm signature.png

KS_PCA using minfi DNAm signature.png
KS_PCA using overlapping DNAm signature.png
KS_PCA using overlapping DNAm signature.png
Each sample is represented by a point on the graph.
Sample classification scores
Raw and probability scores are generated for each sample using the classification model selected by the user.
The following heatmap shows the classification scores generated for each sample (rows) using specific disease models (columns). plr = logistic regression with a regularization penalty, rf = random forest, svm = support vector machine.
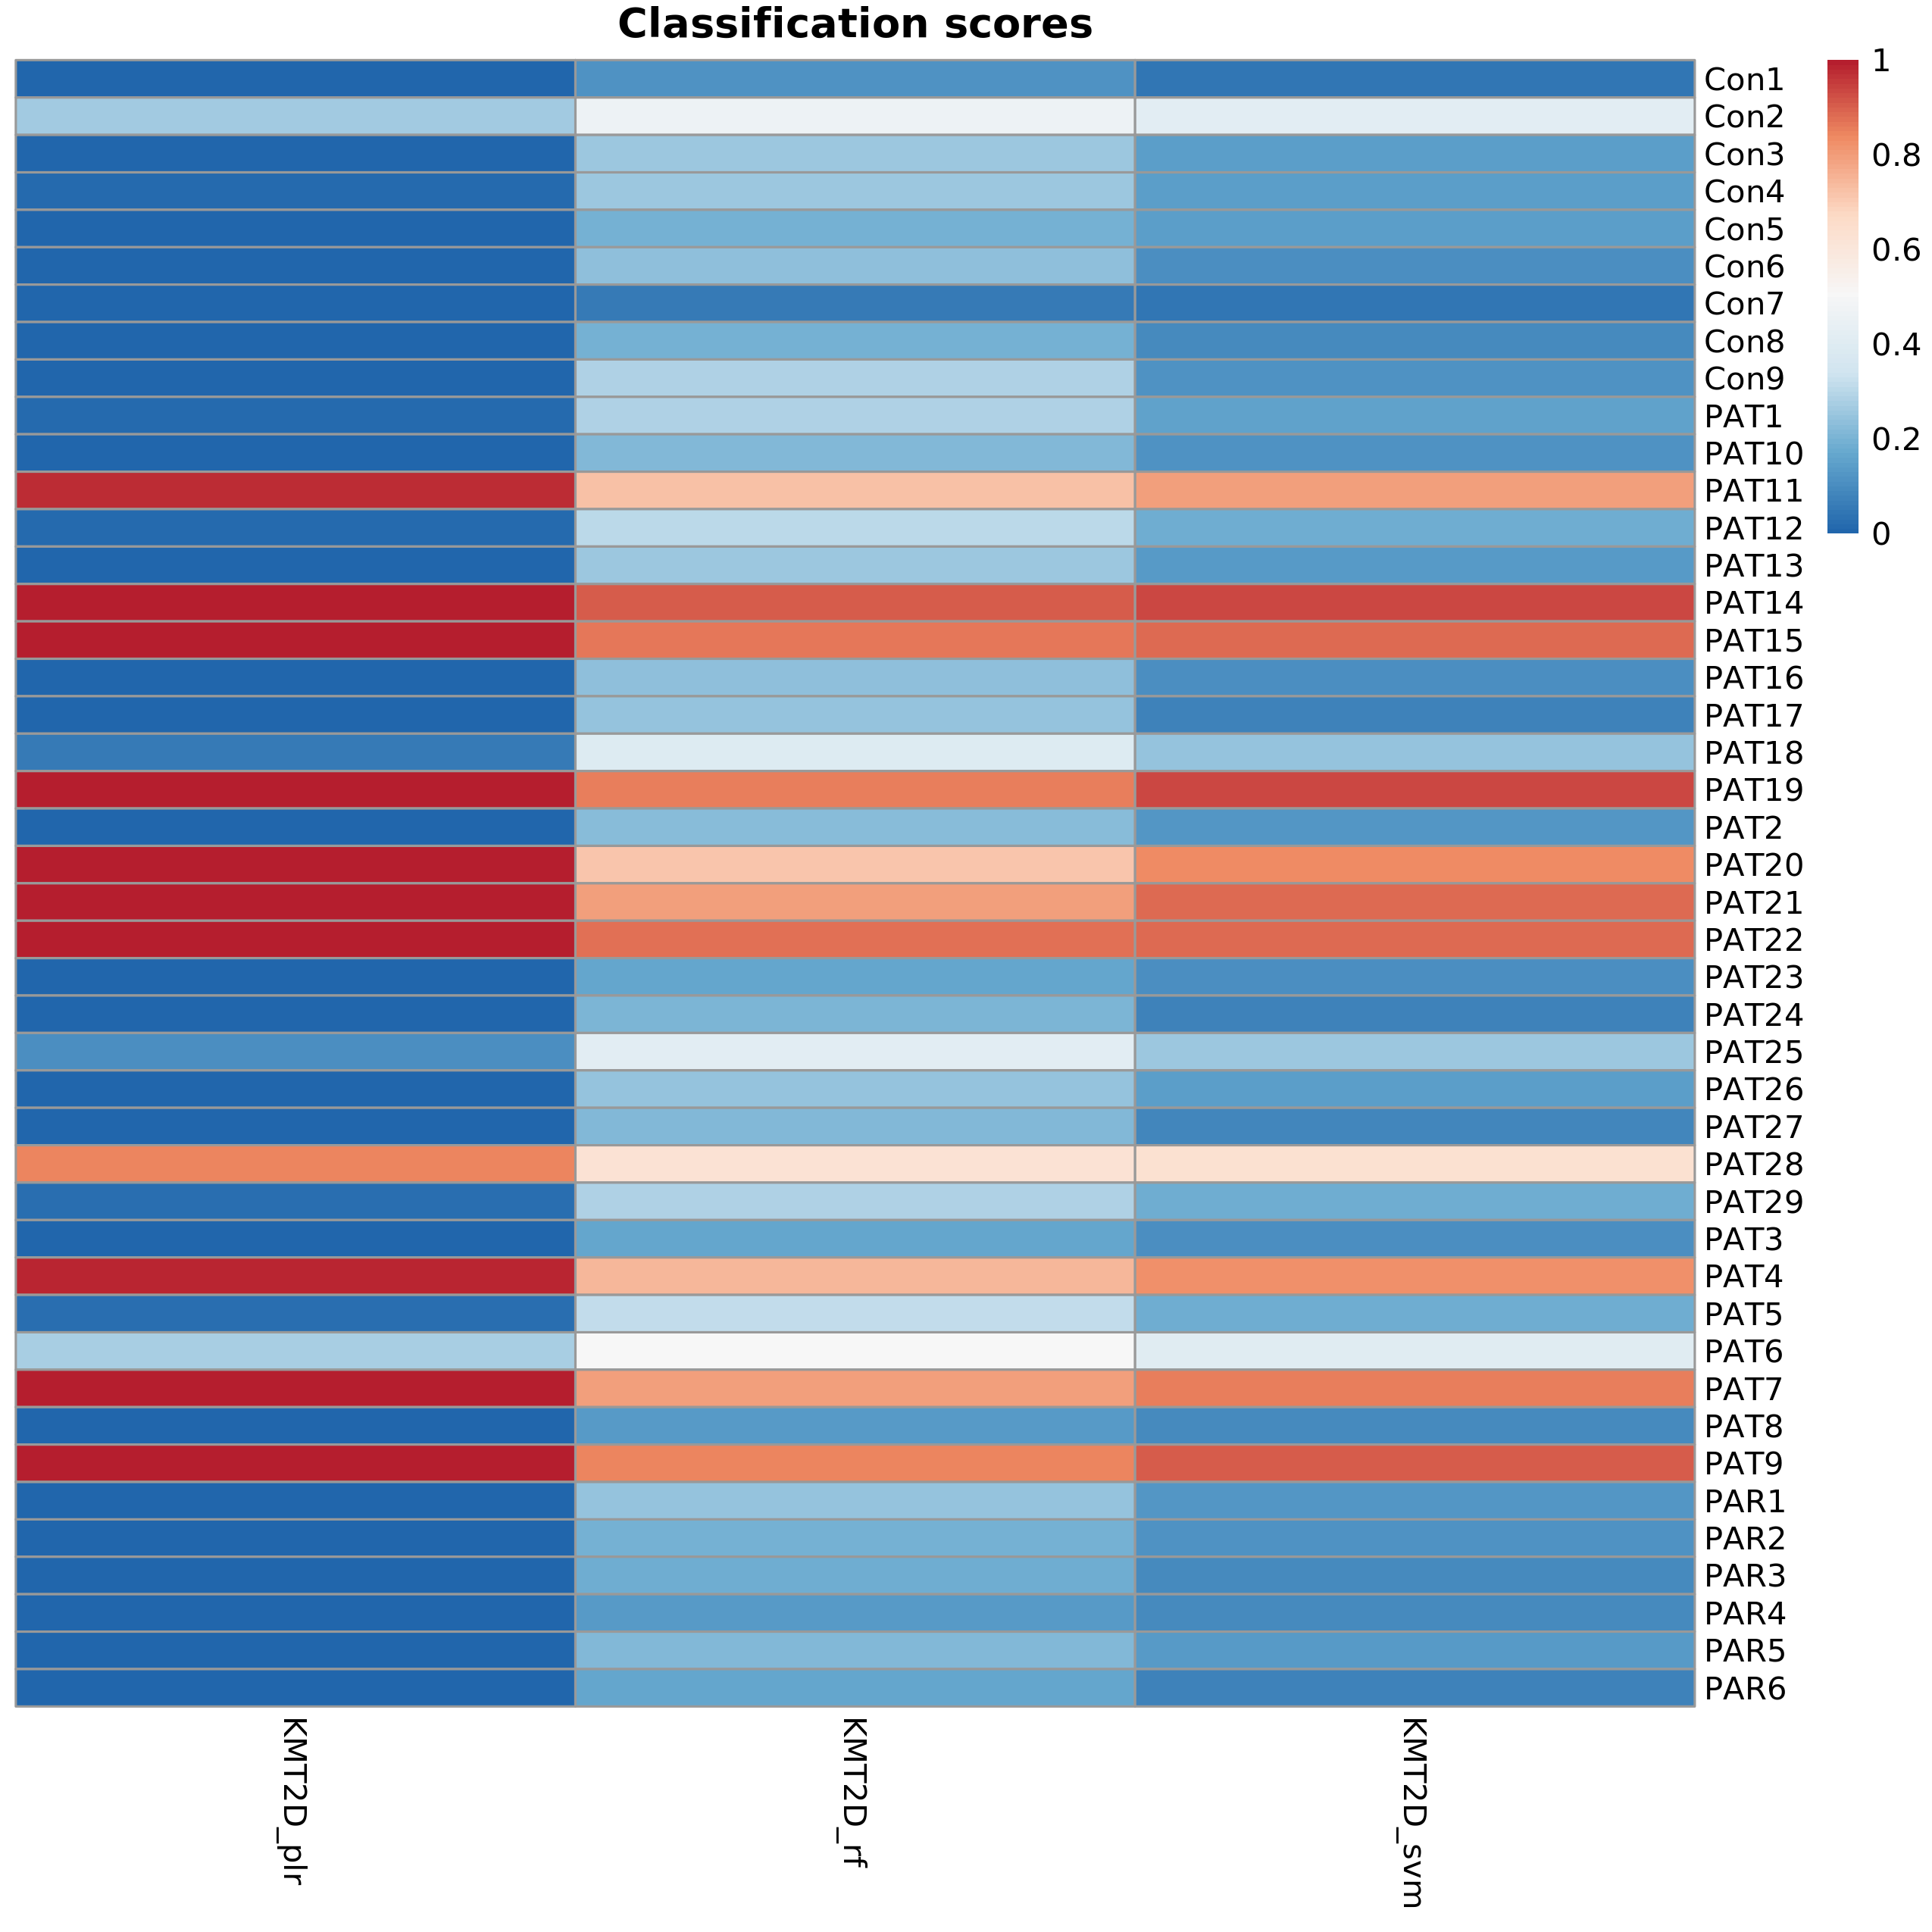
Classification scores
The full table can be downloaded here and a small fragment is shown below.
| Sample Name | Age | Sex | Group | KMT2D plr class | KMT2D plr score | KMT2D rf class | KMT2D rf score | KMT2D svm class | KMT2D svm score |
|---|---|---|---|---|---|---|---|---|---|
| Con1 | NA | M | normal | control | 0.00 | control | 0.11 | control | 0.05 |
| Con2 | NA | M | normal | control | 0.27 | uncertain | 0.47 | uncertain | 0.41 |
| Con3 | NA | F | normal | control | 0.01 | control | 0.26 | control | 0.14 |
| Con4 | NA | F | normal | control | 0.01 | control | 0.26 | control | 0.15 |
| Con5 | NA | M | normal | control | 0.01 | control | 0.20 | control | 0.15 |
| Con6 | NA | F | normal | control | 0.00 | control | 0.24 | control | 0.11 |
Analysis parameters
All analysis parameters are described in this configuration file.